- Growing share in core markets with our robust portfolio: LFL ex Brazil +2.2%
- Actions to drive margin improvement coming through: price/mix +1%
- Execution of comprehensive Brazil turnaround plan on track
Aalst-Erembodegem, July 26, 2018 – Ontex Group NV (Euronext Brussels: ONTEX; ‘Ontex,’ ‘the Group’ or ‘the Company’) today announced its results for the six-month period ended June 30, 2018.
H1 2018 Financial Highlights
- Like-for-like (LFL) revenue growth of 2.2% ex Brazil on higher volumes and positive price/mix
- 5% LFL revenue growth in both Adult Inco and Femcare categories
- Brazil Q2 2018 revenue excluding FX accelerated strongly versus Q1 2018, up by 52%
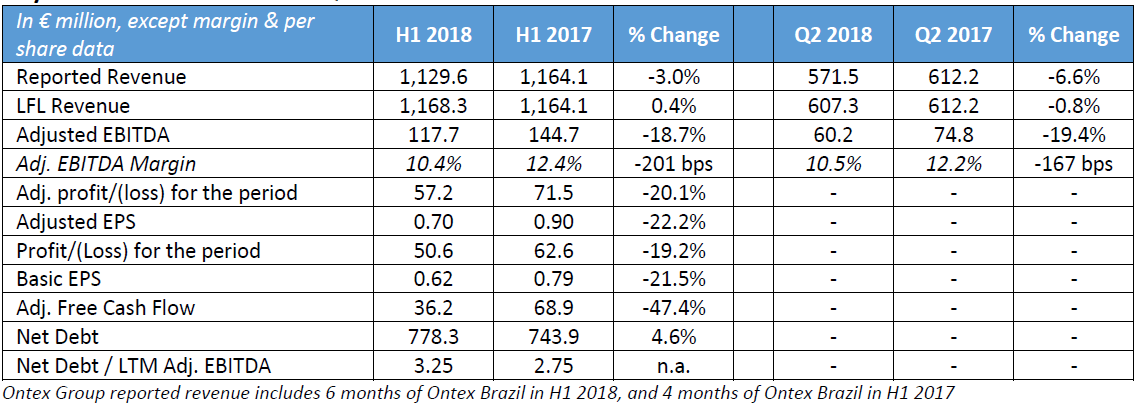
- LFL Group revenue up 0.4%; foreign exchange (FX) headwind of €58.8 million
- Adjusted EBITDA of €117.7 million, Adjusted EBITDA margin of 10.4% (11.6% ex Brazil);
- Consistent actions to drive positive price/mix and savings delivering
- Adjusted EBITDA margin 10.9% at constant FX (2018 FX headwind of €12.2 million)
- Steady reduction of losses in Brazil through H1
- Adjusted EPS of €0.70 supported by benefits of the 2017 refinancing and a lower tax rate
H1 2018 Operational Highlights
- Accelerating innovation pipeline across categories and markets
- Continued growing supply to e-commerce retailers; startup of own digital initiatives
- New capacities in Adult and Baby pants, startup of proprietary production technology in Brazilµ
- Announced consolidation of production in Brazil, yielding €7 million annual EBIT savings
Key Financials H1 2018 and Q2 2018
Charles Bouaziz, Ontex CEO: “This is a resilient set of results amid challenging conditions and we have made good progress against our 2018 priorities. We achieved solid LFL revenue growth outside of Brazil driven by volume and price/mix, while Ontex Brazil improved markedly in Q2. I am pleased that Group adjusted EBITDA margin has improved sequentially since Q4 2017 despite worsening FX and increased input costs. In Brazil, the production consolidation we announced in May and improved trading have ensured that the turnaround is starting to take effect. Finally, we continued to make progress in launching innovations and ramping up capacity for faster-growing, higher-margin products, both of which should increasingly serve us well in the second half of the year.”
Market Dynamics
In the first half of 2018 our markets declined slightly in value versus last year, with strong growth in the Adult Inco category, lower sales in the Babycare category and the Femcare category essentially unchanged. Note that market data does not capture online sales. Sales of retailer brand diapers continued to represent more than half of all diaper volumes sold in the markets of our Mature Market Retail Division, confirming the long term-trend of consumers turning to high-quality innovative products offered by leading retailers.
As expected all raw material indices in H1 2018 increased strongly year-on-year. Current market data points to a similar increase in the second half of 2018.
Nearly all of the currencies in which we conduct business weakened versus the euro in H1 2018, with the weakness intensifying in Q2.
PAI approach
PAI Partners (“PAI”) issued a statement on Monday July 9 which confirmed that it had approached Ontex with an unsolicited and non-binding proposal relating to a possible cash offer for the outstanding shares in Ontex for €27.50 per share. While the Ontex Board of Directors has not agreed to recommend an offer that would be made on these terms, PAI has been given permission to conduct a due diligence which is currently taking place. There can be no certainty that an offer would be made, and if so on which terms and whether or not it would be recommended by the Ontex Board of Directors.
OUTLOOK
We aim to outperform our markets by delivering a low single-digit LFL revenue growth for 2018 in broadly flat hygiene markets. For the balance of 2018, we expect that the hygiene industry will continue to face raw material headwinds, and at current rates FX will have a negative impact on revenue and EBITDA. Notwithstanding these headwinds, we anticipate that adjusted EBITDA margins will improve in H2 as our actions including pricing – which will result in some volume losses; mix and cost savings; new product launches; and, an improving performance in Brazil increasingly take effect.
Operational Review: Categories
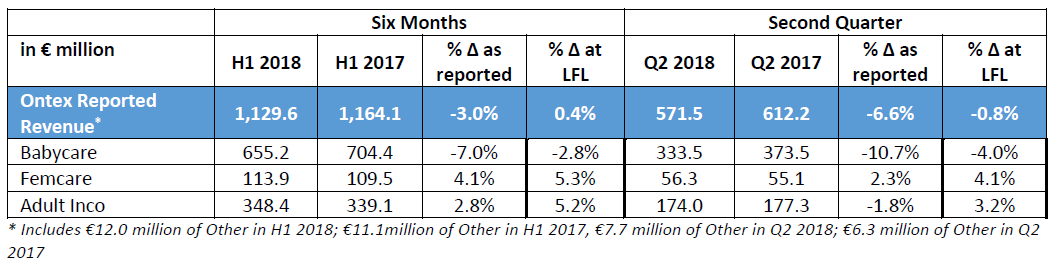
Babycare
LFL revenue in the Babycare category was down 2.8% in H1 2018, reflecting lower diaper volumes in Brazil. Baby pants continued to record strong growth particularly in Europe, where we have invested in new production capacity. Baby diapers had competitive growth in most of our markets outside Brazil.
Femcare
The Femcare category in H1 2018 grew 5.3% LFL, primarily driven by new organic cotton tampon business, as consumers are increasingly looking for attractive alternatives to the international brands.
Adult Inco
Adult Inco category revenue was up 5.2% in H1 2018, reflecting a 9% increase in sales in retail channels, and solid growth in institutional channels. Adult pants sales were significantly higher, and we are investing to ensure we can meet the strong growth in future demand.
Operational Review: Divisions
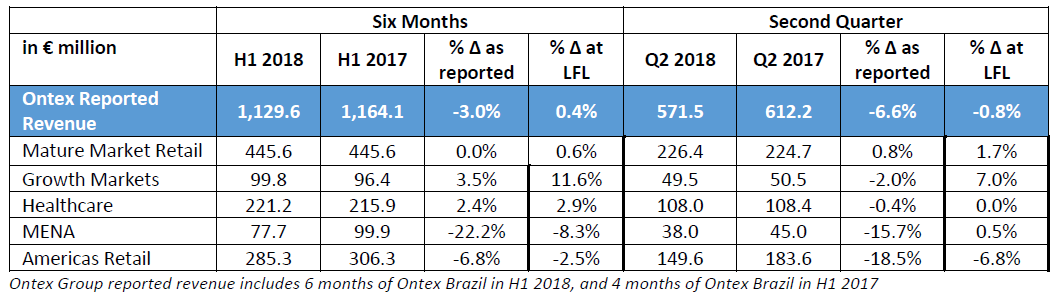
Mature Market Retail
In continued challenging markets, H1 2018 revenue in our Mature Markets Retail Division grew 0.6% LFL against a strong year-on-year comparable, as sales in key categories and to key customers improved in Q2. Volume growth was led by a strong performance in Adult Incontinence and Baby Pants. Competitive performances in the Femcare category and Baby Diapers represented an improvement in Q2. Diapers with our latest channel core technology reached customers’ shelves in H1 2018, allowing leading retailers to offer state-of-the-art innovation with their brands to families.
Strong input cost increases over the past 18 months have been largely absorbed through ongoing savings and operational efficiencies, while we transferred a limited amount to our customers via a price increase during the second quarter. This modest improvement in price/mix in H1 2018 should continue to support Divisional revenue into mid-2019. We will continue strengthening our position as the leading partner for retailers in our categories, by helping them to build their business with an attractive and differentiated offering.
Growth Markets
Growth Markets Division revenue grew 11.6% LFL in H1 2018, building on a strong comparable from 2017 and materially ahead of underlying market growth. The strong revenue performance in H1 was driven by higher volumes and positive price/mix. Growth was broad-based across geographies and categories, with a further acceleration of our Baby Pants business. The Division continues to grow its Russian and Eastern European business despite a very challenging competitive landscape, with levels of promotion remaining extremely high and strong FX headwinds. Our Ethiopian plant ramp-up continued to supply the strong demand for our Canbebe diaper brand, the market leader.
Healthcare
Revenue in the Healthcare Division was up 2.9% in H1 2018, well ahead of estimated market growth. New business wins contributed to higher volumes in most of our geographies. Sales of Adult Pants and Light Inco products continued to increase due to our consistent focus on launching innovative products that respond to consumer needs.
MENA
Middle East and North Africa Division revenue was 8.3% lower in H1 2018 compared to last year, with a clear improvement in Q2 2018 (up 0.5%) after a soft start to the year. A tough competitive environment in Babycare resulted in lower market volumes with positive market pricing. In Turkey, we launched an innovative ultra-thin diaper supported by enhanced in-store activation, while in Algeria we also launched an innovative new diaper. Both cases leveraged the Group’s strong innovation capability together with local marketing and R&D. A lack of liquidity resulted in lower export sales in H1 2018, with signs of improvement for H2.
Americas Retail
H1 2018 Americas Retail Division revenue was down 2.5% compared to a strong first half a year ago. Outside Brazil, revenue was up 5.6%, led by the ongoing success of our local brands in the Babycare and Adult Inco categories in Mexico. When we acquired Grupo Mabe in 2016, we planned to leverage this platform to explore opportunities to develop retailer brands in the US, the world’s largest market by value, and in Q2 we started shipping our first, highly differentiated retailer branded diaper to a major US retailer. In Brazil, we have rapidly taken several important steps in the first half of 2018 which will result in new product innovations and improved operational efficiency in the second half of the year. We have already started to see early benefits from these actions on revenue and profitability. Brazil delivered more than 50% sequential revenue growth in Q2 2018 compared to Q1 excluding FX. From a profitability perspective, losses in Brazil reduced steadily over the course of the first half.
Operational Review: Geographies

In spite of strong negative FX impacts, more than half of Group reported revenue was generated outside of Western Europe, mostly in developing markets, which based upon demographics and product usage rates are projected to grow faster than overall category growth for the next several years. Sales in Western Europe represented 49% of Group reported revenue, supported by LFL growth and a limited negative FX impact.
Financial Review
Selected Financial Information
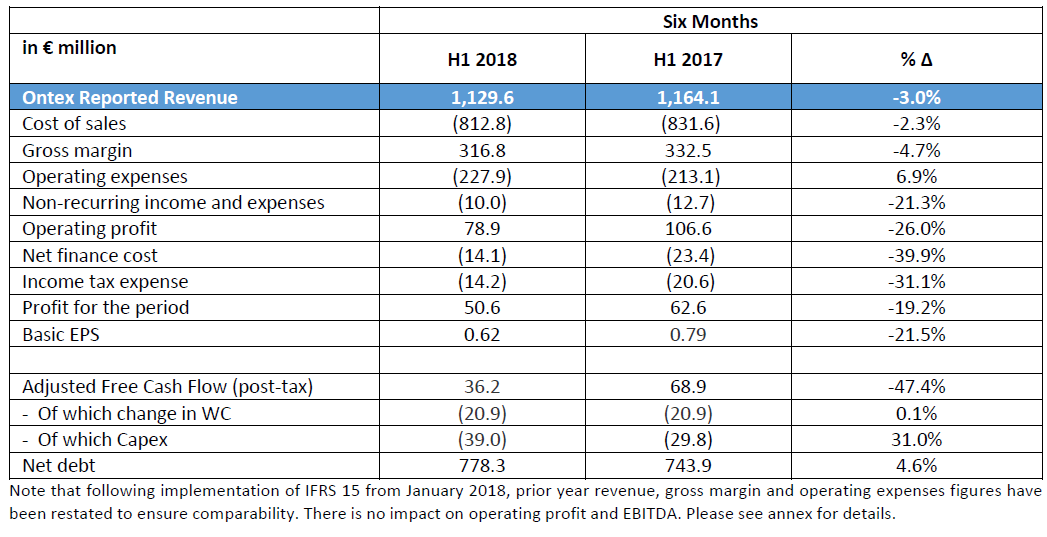
Gross Margin
Gross margin came in at €316.8 million in H1 2018, and gross margin as a percentage of sales of 28.0% was 52 basis points below last year. This is entirely due to a lower gross margin in Brazil, whereas the balance of the Ontex business demonstrated resilience as higher sales volumes, a positive price/mix impact and significant savings offset the large negative impacts of higher raw materials and FX.
Adjusted EBITDA
H1 2018 Adjusted EBITDA was €117.7 million, or 18.7% lower than the high comparable base a year ago. Apart from the change in gross margin explained above, the evolution is mainly due to higher sales and marketing expenses, mostly reflecting the inclusion of the fully branded Brazil business for 6 months in 2018 compared to only 4 months last year.
Foreign Exchange
As expected and communicated previously, there was a meaningful negative impact from changes in foreign exchange rates on both Group revenue and Adjusted EBITDA in H1 2018, with nearly all currencies weakening versus the euro compared to a year ago. At Group revenue level, the FX impact was -€58.8 million, mostly due to the main currencies in the Americas Retail, MENA and Growth Markets Divisions. For Adjusted EBITDA, the impact was -€12.2 million as a result of the same currencies except the US Dollar (USD), which had a positive impact due to the amount of raw materials purchased in USD.
Net Finance Costs
Net finance costs were €14.1 million in H1 2018, a decrease of €9.3 million versus last year. The decrease is primarily due to a lower interest expense, as a result of the successful refinancing completed at the end of 2017.
Income Tax Expense
H1 2018 income tax expense was €14.2 million. The effective tax rate was 21.9%, within the company’s expectation of an effective tax rate of 24% or less.
Working Capital
Working capital as a percentage of revenue was 11.5% in H1 2018, within our target to keep at 12% or lower.
Capex
Capital expenditure amounted to €39.0 million in the first half of 2018, including investments in Adult and Baby pants, and leveraging our proprietary in-house diaper production technology to place new lines in Brazil. Full year 2018 capex is expected to be approximately 5% of sales, slightly above the mid-term rate due to the planned production upgrade in Brazil and focus on capturing higher growth in Baby and Adult pants.
Adjusted Free Cash Flow (post-tax)
Adjusted free cash flow (post-tax) was €36.2 million in H1 2018. The main driver compared to last year was lower adjusted EBITDA compared to a high comparable base in 2017. In addition, capex increased as expected.
Net debt
At June 30, 2017, net debt was €778.3 million with net leverage based on the last twelve months Adjusted EBITDA of 3.25x.
Corporate information
The above press release and related financial information of Ontex Group NV for the three and six months ended June 30, 2018 was authorized for issue in accordance with a resolution of the Board of Directors on July 25, 2018.
Alternative Performance Measures
The following alternative performance measures (non-GAAP) have been included in this press release since management believes that they are widely used by certain investors, securities analysts and other interested parties as supplemental measures of performance and liquidity. The alternative performance measures may not be comparable to similarly titled measures of other companies and have limitations as analytical tools and should not be considered in isolation or as a substitute for analysis of our operating results, our performance or our liquidity under IFRS.
Like-for-like revenue (LFL)
Like-for-like revenue is defined as revenue at constant currency excluding change in perimeter of consolidation or M&A.
Non-recurring Income and expenses
Non-recurring income and expenses are those items that are considered by management not to relate to items in the ordinary course of activities of the Company. They are presented separately as they are important for the understanding of users of the consolidated financial statements of the “normal” performance of the company due to their size or nature. The non-recurring income and expenses relate to:
• Acquisition-related expenses;
• changes to the measurement of contingent considerations in the context of business combinations;
• business restructuring costs, including costs related to the liquidation of subsidiaries and the closure, opening or relocations of factories;
• asset impairment costs.
Non-recurring income and expenses of the Group are composed of the following items presented in the consolidated income statement as reported in the half-year condensed financial statements and the annual financial statements:
• Income/(expenses) related to changes to Group structure; and
• Income/(expenses) related to impairments and major litigations.
EBITDA and Adjusted EBITDA and related margins
EBITDA is defined as earnings before net finance cost, income taxes, depreciation and amortisation. Adjusted EBITDA is defined as EBITDA plus non-recurring income and expenses. EBITDA and Adjusted EBITDA margins are EBITDA and Adjusted EBITDA divided by revenue.
Net financial debt/LTM Adjusted EBITDA ratio (Leverage)
Net financial debt is calculated by adding current and non-current term debt and deducting cash and cash equivalents. LTM adjusted EBITDA is defined as EBITDA plus non-recurring income and expenses for the last twelve months (LTM).
Adjusted Free Cash Flow
Adjusted Free Cash Flow is defined as Adjusted EBITDA less capital expenditures (Capex, defined as purchases of property, plant and equipment and intangibles), less change in working capital, less cash taxes paid.
Adjusted Profit & Adjusted EPS (earnings per share)
Adjusted Profit is defined as profit for the period plus non-recurring income and expenses and tax effect on non-recurring income and expenses, attributable to the owners of the parent. Adjusted EPS is Adjusted Profit divided by the weighted average number of ordinary shares.
Working Capital
The components of our working capital are inventories plus trade and other receivables and prepaid expenses plus trade and other payables and accrued expenses.
Conference call
Management will host a presentation for investors and analysts on July 26, 2018 at 8:00am BST/9:00am CEST. A copy of the presentation slides will be available at:
http://www.ontexglobal.com/financial-reports-including-annual-reviews
If you would like to participate in the conference call, please dial-in 5 to 10 minutes prior using the details below:
United Kingdom +44 (0)330 336 9125
United States +1 929 477 0448
Belgium +32 (0)2 404 0659
France +33 (0)1 70 72 25 50
Germany +49 (0)69 2222 25574
Passcode 1336905
A replay of the conference call will also be available for one week afterwards:
United Kingdom +44 (0) 207 660 0134
United States +1 719 457 0820
Belgium +32 (0) 2 620 0568
France +33 (0) 1 70 48 00 94
Germany +49 (0) 69 2000 1800
Passcode 1336905
Financial calendar 2018
Q3 2018 November 7, 2018
Contact
DISCLAIMER
This report may include forward-looking statements. Forward-looking statements are statements regarding or based upon our management’s current intentions, beliefs or expectations relating to, among other things, Ontex’s future results of operations, financial condition, liquidity, prospects, growth, strategies or developments in the industry in which we operate. By their nature, forward-looking statements are subject to risks, uncertainties and assumptions that could cause actual results or future events to differ materially from those expressed or implied thereby. These risks, uncertainties and assumptions could adversely affect the outcome and financial effects of the plans and events described herein.
Forward-looking statements contained in this report regarding trends or current activities should not be taken as a report that such trends or activities will continue in the future. We undertake no obligation to update or revise any forward-looking statements, whether as a result of new information, future events or otherwise. You should not place undue reliance on any such forward-looking statements, which speak only as of the date of this report.
The information contained in this report is subject to change without notice. No re-report or warranty, express or implied, is made as to the fairness, accuracy, reasonableness or completeness of the information contained herein and no reliance should be placed on it.
In most of the tables of this report, amounts are shown in € million for reasons of transparency. This may give rise to rounding differences in the tables presented in the report.
This report has been prepared in Dutch and translated into English. In the case of discrepancies between the two versions, the Dutch version will prevail.