- Enhanced geographic and product portfolio drove solid LFL revenue growth
- Resilient Adj. EBITDA margin at constant currency through savings and price/mix actions
- Execution of turnaround plan in Brazil well on track
Aalst-Erembodegem, March 8, 2019 – Ontex Group NV (Euronext Brussels: ONTEX; ‘Ontex,’ ‘the Group’ or ‘the Company’) today announced its results for the twelve months ending December 31, 2018.
FY 2018 Financial Highlights
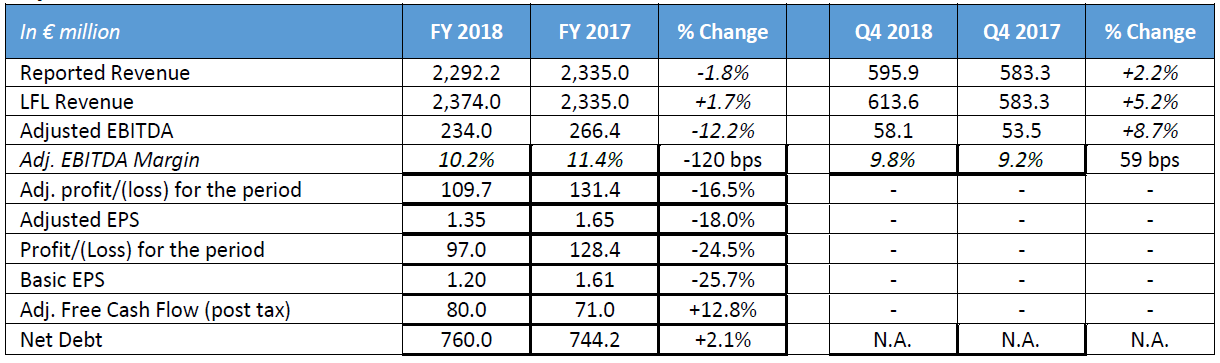
- Reported revenue of €2.29 billion (€2.39 billion at constant currency)
- Like-for-like (LFL) revenue growth of 1.7% thanks to improved pricing and mix
- Increased pricing more than offset volume decrease
- Brazil revenue in local currency grew sequentially each quarter in 2018
- Adjusted EBITDA of €234 million (€261 million at constant currency)
- Adjusted EBITDA margin of 10.9% at constant currency
- Adjusted EBITDA margin of 10.2%; 11.0% excluding Brazil
- Brazil Adjusted EBITDA improved sequentially each quarter of 2018
- Adjusted EPS of €1.35 included structurally lower finance costs and lower tax expenses
- Proposed gross dividend of €0.41 per share, in line with Ontex’s policy to pay out 35% of net profit
Significant progress in addressing our 2018 priorities
- Focus on profitability of core business: Pricing to mitigate raw material headwinds, enhanced mix and savings program
- More competitive growth portfolio: Further acceleration of pants, first expansion in US retailer brands and in organic tampons
- Sustainable improvements at Ontex Brazil: Baby diaper brands relaunched and production concentrated on one site
Key Financials FY 2018 and Q4 2018
Transform to Grow (T2G) program and appointment of Thierry Navarre as Chief Transformation Officer
In Q4 2018, we initiated Transform to Grow (“T2G”), our comprehensive transformation program to enhance Ontex’s competitiveness and return to sustainable growth. In this context, Thierry Navarre has been appointed to the new role of Chief Transformation Officer to lead this critical program, after serving for 10 years as Chief Operating Officer.
New organization and reporting structure implemented
We have revamped our organization in order to better seize opportunities arising from our geographic expansion with the establishment of new growth platforms in the Americas and sub-Saharan Africa, improve execution and bolster focus on our competitive differentiators. The Company’s commercial activities are now organized in three Divisions:
- Europe, which is predominantly focused on retail brands
- Americas, Middle East, Africa and Asia (AMEAA), which is predominantly focused on local brands
- Healthcare, which continues to focus on the institutional markets and dedicated incontinence brands
Group Manufacturing and Supply Chain have been regrouped into a newly-created Operations unit, with a focus on production efficiency and customer service excellence.
As of Q1 2019, Ontex’s revenue will be presented in accordance with these three commercial Divisions. Please see annex B in this release for 2018 revenue restated accordingly.
Investor Update
We will host an Investor Update event on Wednesday, May 8, 2019, the day of our Q1 2019 Trading Update. The Trading Update conference call for investors and analysts will take place at 9.00am CET/8.00am UK, with a meeting for investors and analysts in London following later that day.
The event will be hosted by members of the Ontex management team and will provide an update on Ontex’s strategy and its implementation, leveraging the outcome of our T2G program currently underway.
Management comment
Charles Bouaziz, Ontex CEO, commented: “Ontex delivered sound LFL revenue growth in 2018 despite a difficult market environment. Both Adult Inco and Femcare sales grew, while Babycare sales improved in H2 after a slow start to the year. Dynamic pricing actions and continued savings mitigated the strong raw materials and FX headwinds that we faced in 2018. As a result, our adjusted EBITDA margin decrease was contained to 50bps at constant currency. Furthermore, we delivered higher adjusted free cash-flow. Ontex is fully mobilized to make the T2G transformation program a success. We will provide an update of our strategy and ambitions going forward during the investor event scheduled in London on May 8.”
Outlook
For 2019, we anticipate further top-line growth in developing markets, and lower revenue in developed markets. We expect to improve adjusted EBITDA at constant currency1, despite a slow start to the year in Q1 2019 due to continued, but stabilizing, raw material and FX headwinds. Our pricing, mix improvement and cost savings actions should start taking effect in the second half of the year.
As a consequence of our increased international footprint, going forward we will report adjusted EBITDA at constant currency alongside LFL revenue, as they provide a fairer measure of our underlying performance.
Market Dynamics
Personal hygiene markets (Babycare, Femcare and Adult Inco categories) in which Ontex is present remained broadly unchanged overall in 2018 compared with 2017. Babycare category value decreased, with lower volumes, but price/mix turned positive and the shift from baby diapers to baby pants continued. As expected, Adult Inco showed the highest category value growth.
Retailer brands maintained their solid position in all three personal hygiene categories as a competitive alternative to international brands in Western Europe, while retailer brands continued to grow faster than the overall market in Russia.
Market indices for most of the main commodity raw materials increased during the year and were materially higher on average in 2018 compared to 2017.
Most currencies we do business in weakened versus the euro in 2018.
Operational Review: Categories
Babycare
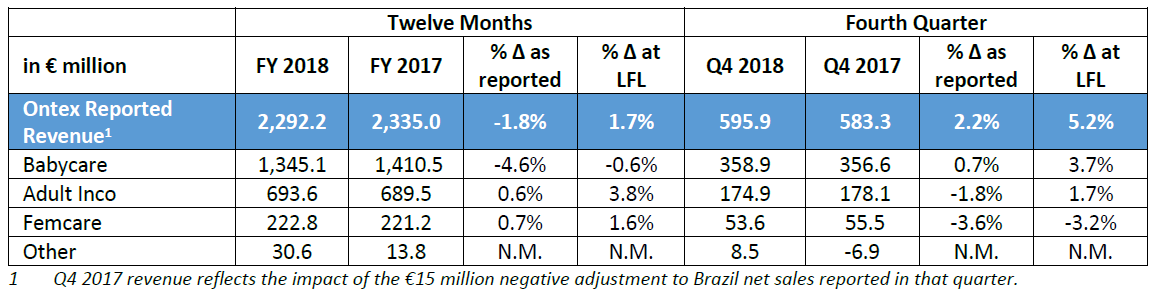
Babycare revenue was slightly lower at -0.6% for FY 2018. However, sales improved in the second half of the year. Revenue of Baby pants continued to grow strongly, benefiting from additional production capacity which came on stream during 2018. Sales of our local baby diaper brands rose in the majority of our markets.
Adult Inco
FY 2018 Adult Inco revenue grew 3.8%. Sales in retail channels rose 9% due to the leadership positions of our brands in several developing markets. Revenue also rose in institutional channels. Growth of Adult pants was an important driver of category sales, supported by investments in increased production capacity.
Femcare
Revenue in Femcare was up 1.6% in FY 2018, mainly driven by growing organic cotton tampon sales. This category was supported by consumer trends towards more natural materials in both products and packaging.
Operational Review: Divisions
Mature Market Retail
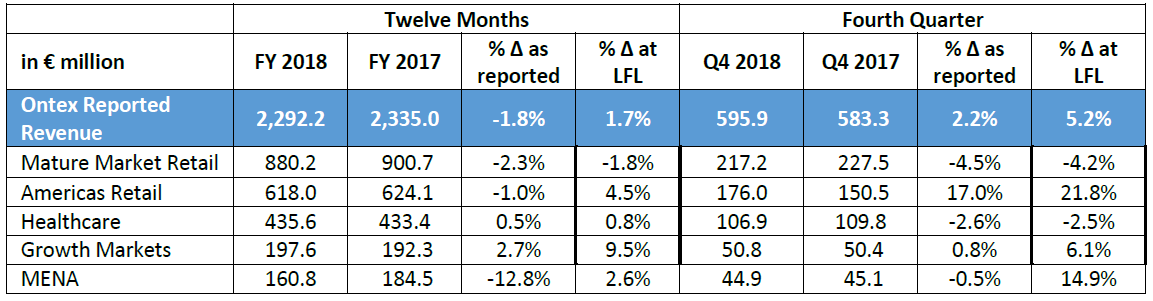
Mature Market Retail revenue decreased 1.8% in FY 2018 on a challenging comparable base following strong growth of 5.1% in 2017. Solid increases in revenue of Baby pants and Adult pants did not fully offset the anticipated decline in baby diapers. This resulted from a price increase to partly compensate materially higher input costs across the Group. We strengthened further our capabilities to build our customers’ businesses through investments in additional production capacity, including a new plant in Poland, demonstrating our commitment to Central and Eastern European markets.
Americas Retail
Americas Retail delivered a 4.5% increase in revenue in FY 2018, strongly outperforming the market. Higher sales resulted from volume increases in most markets and positive price/mix. In Mexico, we had another year of solid market share performance in both Baby care and Adult Inco, based on our portfolio of strong local brands, complemented with innovations such as baby diapers with enhanced softness and absorption. Sales in the US grew strongly thanks to our first retailer brand diaper for a leading US customer, leveraging the deep knowledge we have gained in Europe. Feminine Care sales in the US increased thanks to the growing trend towards organic lifestyle products. In Brazil, our team made major strides in strengthening the business, including concentrating all production on one site, starting up Ontex proprietary production lines and re-launching two of our local baby diaper brands. In local currency, sales in Brazil improved sequentially each quarter of 2018, resulting in a limited decrease on a LFL basis.
Healthcare
Revenue in Healthcare increased 0.8% in FY 2018, ahead of estimated underlying market growth. The consistent focus on leveraging our brands such as Serenity and iD, and developing sales in self-pay channels, were important drivers. During the year, we launched a new high-absorbency adult pants platform, bringing enhanced levels of comfort, discretion and femininity to meet consumer needs. We generated double-digit growth in sales of Adult pants through additional capacity.
Growth Markets
Growth Markets revenue grew 9.5% in FY 2018, significantly ahead of its relevant markets. This solid progress was the result of increased volumes as well as an improved product mix, with particularly strong growth in Adult and Baby pants, in which the Group has stepped up investment over the past two years. We also strengthened our market leadership in baby diapers in Ethiopia since we started local production in mid-2017. Despite continuously rising industry input costs and negative FX, the pricing environment in Eastern Europe remained highly competitive as all players focused on market share.
MENA
Revenue in Middle East and North Africa increased by 2.6% in FY 2018 with double-digit sales growth in the second half of the year. Our local teams navigated well in volatile environments marked by significantly weaker currencies by adapting pricing, launching innovations, stepping up in-store commercial activities and leveraging the strength of Canped, our leading Adult Inco brand. We also made important investments in upgrading our production capabilities, which should position us well for future growth.
Operational Review: Geographies
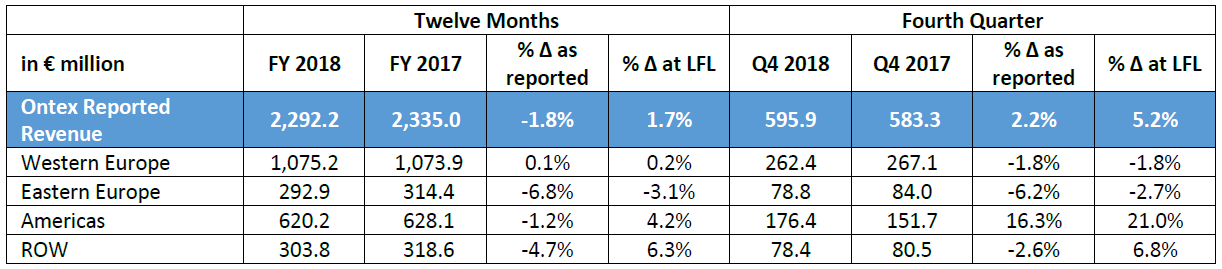
Most geographies contributed to higher revenue in FY 2018. The proportion of Group revenue by geography remained broadly unchanged, despite the strong negative FX impacts outside of Western Europe, confirming the benefit of our increased presence in faster growing markets.
FINANCIAL REVIEW
Selected P&L Financial Information
Selected Liquidity Financial Information
Gross Margin
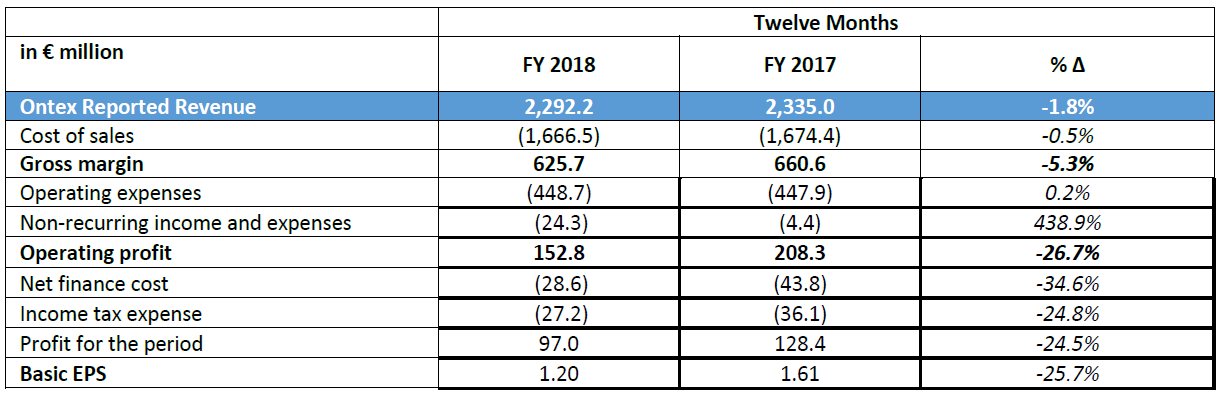
Gross margin of €625.7 million in FY 2018 was 5.3% lower than the previous year. As a result, gross margin as a percentage of sales was 27.3%, 99 basis points below 2017. Improved pricing and significant savings and efficiencies more than compensated for higher raw material costs; however, our actions could not fully offset the strong negative FX impacts.
Adjusted EBITDA
2018 Adjusted EBITDA was €234.0 million, 12.2% lower than a year ago. The decrease is mainly explained by the lower gross margin detailed above. Distribution expenses as a percentage of sales in 2018 were at the same level as in 2017, with improvement in the second half of 2018 as additional production capacity became available. We also continued to invest in sales, marketing and R&D to support top-line growth.
Foreign Exchange
As disclosed during 2018, variations in foreign exchange rates versus the euro resulted in strong negative impacts on Group reported revenue and Adjusted EBITDA. The estimated full year impact on Group revenue was -€102 million, related to most currencies in which we do business, predominantly the Brazilian Real, the Mexican Peso, the Turkish Lira and the Russian Rouble.
The estimated FX impact on Adjusted EBITDA in 2017 was -€27 million, also related to most currencies in which we do business except for the US Dollar, which had a positive effect due to raw material purchases in this currency.
Net Finance Costs
Net finance costs decreased by c. 35% to €28.6 million, driven by lower finance expenses from the full refinancing of the Group’s debt at the end of 2017.
Income Tax Expense
The 2018 income tax expense was €27.2 million, with an effective tax rate of 21.9%, below our guidance of approximately 24%.
Working Capital
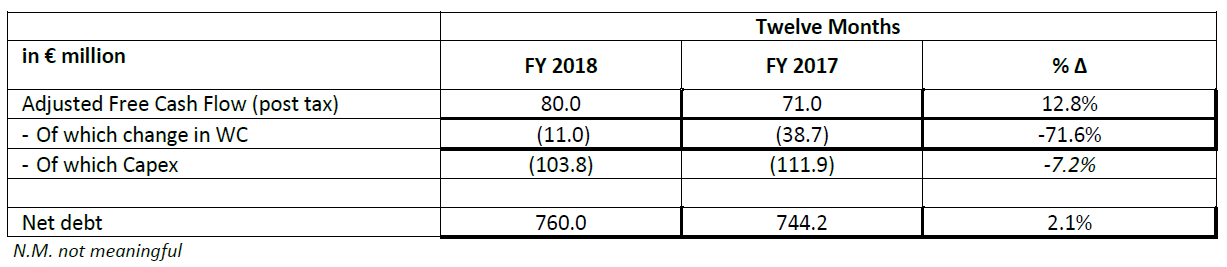
Working capital as a percentage of revenue was 11.2% in 2018, well within our objective of keeping working capital requirements at or below 12% of revenue. Efforts continued in order to achieve structural improvements in working capital on an ongoing basis, while ensuring full support for the business.
Capex
2018 capital expenditures were €103.8 million, or 4.5% of revenue. As foreseen, capex in 2017 and 2018 was a higher proportion of revenue than in previous years, mostly due to the planned update of production lines at Ontex Brazil, and to the acceleration of investment in Baby and Adult pants capacity, which have posted faster growth.
Adjusted Free Cash Flow (post tax)
Adjusted free cash flow (post tax) was €80.0 million in 2018, an increase of 12.8% compared to the previous year. This increase is mainly due to decreased working capital, as well as lower capex and cash taxes paid versus 2017.
Financing or Net Debt
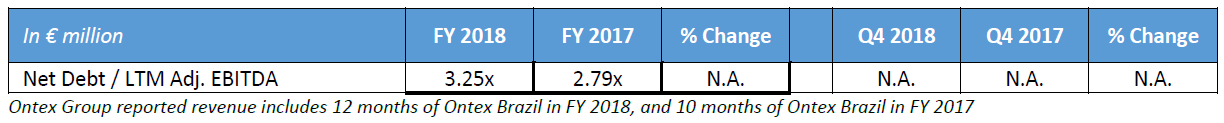
At December 31, 2018 net debt was €760.0 million, and net leverage based on the last twelve months Adjusted EBITDA was 3.25x. The full refinancing of Group debt at the end of 2017 resulted in a meaningful extension of debt maturities, with no material repayments due until 2022 and 2024, as well as a lower cost of debt, with the interest rate risk largely hedged.
Corporate information
The above press release and related financial information of Ontex Group NV for the twelve months ended December 31, 2018 was authorized for issue in accordance with a resolution of the Board on March 7, 2019.
CONFERENCE CALL
Management will host a presentation for investors and analysts on March 8, 2019 at 8:00am GMT/9:00am CET.
A copy of the presentation slides will be available at http://www.ontexglobal.com/
If you would like to participate in the conference call, please dial-in 5 to 10 minutes prior using the details below:
United Kingdom +44 (0)330 336 9411
United States +1 323-994-2093
Belgium +32 (0)2 400 6926
France +33 (0)1 76 77 22 57
Germany +49 (0)69 2222 2018
Passcode: 5363865
FINANCIAL CALENDAR 2019
Q1 2019 May 8, 2019
AGM May 24, 2019
H1 2019 July 31, 2019
Q3 2019 November 6, 2019
Contact
NOTES TO THE CONSOLIDATED FINANCIAL INFORMATION
Note 1 Legal Status
Ontex Group NV is a limited-liability company incorporated as a “naamloze vennootschap“ (“NV”) under Belgian law with company registration number 0550.880.915. Ontex Group NV has its registered office at Korte Keppestraat 21, 9320 Erembodegem (Aalst), Belgium. The shares of Ontex Group NV are listed on the regulated market of Euronext Brussels.
Note 2 Accounting Policies
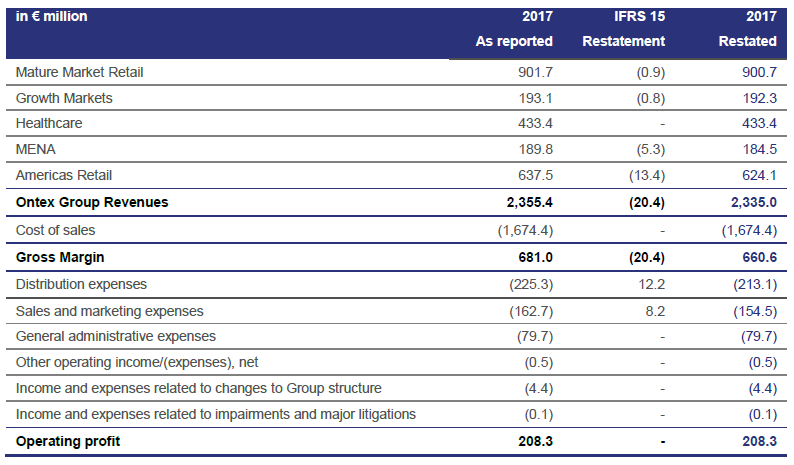
The accounting policies used to prepare the financial statements for the period from January 1, 2018 to December 31, 2018 are consistent with those applied in the audited consolidated financial statement for the year ended December 31, 2017 of Ontex Group NV, except for the introduction of the new requirements applied to revenue as a result of the application of IFRS 15 – Revenue from Contracts with Customers and IFRS 9 – Financial Instruments. The accounting policies have been consistently applied to all the periods presented.
The impact of the changes in accounting policies due to the application of IFRS 15 on the consolidated income statement for the year ended December 31, 2018 is presented below. As a result of the application of the revised accounting policies due to the application of IFRS 15 on a full retrospective basis, reclassifications were done in the consolidated income statement for the year ended December 31, 2017 relating to fees paid to customers and agents for distinct services from net sales to distribution expenses and sales and marketing expenses for respectively € 12.2 million and € 8.2 million:
Note 3 Events after the Reporting Period
On March 7 2019, Ontex informed its employees at the Yangzhou (China) plant of its intention to cease production by mid-2019. This plant primarily manufactures feminine care products for the Western European market, and this production will be re-allocated to other Ontex plants. Ontex does not expect this decision to have a significant impact on the Group financial results.
Note 4 Auditors Report
The statutory auditor has confirmed that the audit, which is substantially complete, has not to date revealed any material misstatement in the draft consolidated accounts, and that the accounting data reported in the press release is consistent, in all material respects, with the draft accounts from which it has been derived.
Note 5 Alternative Performance Measures
Alternative performance measures (non-GAAP) are used in this press release since management believes that they are widely used by certain investors, securities analysts and other interested parties as supplemental measure of performance and liquidity. The alternative performance measures may not be comparable to similarly titled measures of other companies and have limitations as analytical tools and should not be considered in isolation or as a substitute for analysis of our operating results, our performance or our liquidity under IFRS.
Like-for-like revenue (LFL)
Like-for-like revenue is defined as revenue at constant currency excluding change in scope of consolidation or M&A.
Non-recurring Income and expenses
Items classified under the heading non-recurring income and expenses are those items that are considered by management not to relate to items in the ordinary course of activities of the Company. They are presented separately as they are important for the understanding of users of the consolidated financial statements of the “normal” performance of the company due to their size or nature. The non-recurring income and expenses relate to:
• acquisition-related expenses;
• changes to the measurement of contingent considerations in the context of business combinations;
• business restructuring costs, including costs related to the liquidation of subsidiaries and the closure, opening or relocations of factories;
• impairment of assets.
Non-recurring income and expenses of the Group are composed of the following items presented in the consolidated income statement:
• Income/(expenses) related to changes to Group structure; and
• Income/(expenses) related to impairments and major litigations.
EBITDA and Adjusted EBITDA and related margins
EBITDA is defined as earnings before net finance cost, income taxes, depreciations and amortizations. Adjusted EBITDA is defined as EBITDA plus non-recurring income and expenses. EBITDA and Adjusted EBITDA margins are EBITDA and Adjusted EBITDA divided by revenue.
Net financial debt/LTM Adjusted EBITDA ratio (Leverage)
Net financial debt is calculated by adding short-term and long-term debt and deducting cash and cash equivalents. LTM adjusted EBITDA is defined as EBITDA plus non-recurring income and expenses for the last twelve months (LTM).
Adjusted Free Cash Flow
Adjusted Free Cash Flow is defined as Adjusted EBITDA less capital expenditures (Capex, defined as purchases of property, plant and equipment and intangible assets), less change in working capital, less income taxes paid.
Adjusted Profit & Adjusted EPS (earnings per share)
Adjusted Profit is defined as profit for the period plus non-recurring income and expenses and tax effect on non-recurring income and expenses, attributable to the owners of the parent. Adjusted EPS is Adjusted Profit divided by the weighted average number of ordinary shares.
Working Capital
The components of our working capital are inventories plus trade receivables and prepaid expenses and other receivables plus trade payables and accrued expenses and other payables.
DISCLAIMER
This report may include forward-looking statements. Forward-looking statements are statements regarding or based upon our management’s current intentions, beliefs or expectations relating to, among other things, Ontex’s future results of operations, financial condition, liquidity, prospects, growth, strategies or developments in the industry in which we operate. By their nature, forward-looking statements are subject to risks, uncertainties and assumptions that could cause actual results or future events to differ materially from those expressed or implied thereby. These risks, uncertainties and assumptions could adversely affect the outcome and financial effects of the plans and events described herein.
Forward-looking statements contained in this report regarding trends or current activities should not be taken as a report that such trends or activities will continue in the future. We undertake no obligation to update or revise any forward-looking statements, whether as a result of new information, future events or otherwise. You should not place undue reliance on any such forward-looking statements, which speak only as of the date of this report.
The information contained in this report is subject to change without notice. No re-report or warranty, express or implied, is made as to the fairness, accuracy, reasonableness or completeness of the information contained herein and no reliance should be placed on it.
In most of the tables of this report, amounts are shown in € million for reasons of transparency. This may give rise to rounding differences in the tables presented in the trading update.
This trading update has been prepared in Dutch and translated into English. In the case of discrepancies between the two versions, the Dutch version will prevail.