- 1.7% LFL revenue growth with positive volumes and price/mix
- Sequential improvement of margins
- Progress on our actions in Brazil with full benefits expected in H2 onwards
- Full Year Guidance confirmed
Aalst-Erembodegem, May 9, 2018 – Ontex Group NV (Euronext Brussels: ONTEX; ‘Ontex,’ ‘the Group’ or ‘the Company’) today announced its trading update for the three-month period ended March 31, 2018.
Q1 2018 Highlights
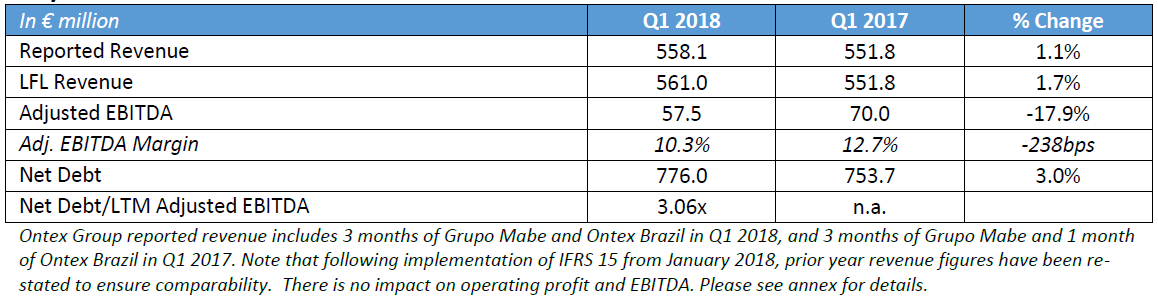
- Solid top line performance with revenue of €558.1 million, up 1.7% on a like-for-like (LFL) basis, while foreign exchange (FX) was a €23.1 million headwind
- LFL increase due to higher volumes and price/mix
- +2.3% LFL for Ontex business excluding Brazil
- Strong performances in Adult Incontinence and Feminine Care
- Sequential improvement in margins; Adjusted EBITDA of €57.5 million despite a €3.2 million FX headwind and higher raw material costs
- Adjusted EBITDA margin of 10.3% (11.5% excluding Brazil) vs 9.2% in Q4 2017
- Actions taken in Brazil expected to support return to profitable growth in H2 2018
- Net debt was €776.0 million for a net debt/LTM Adjusted EBITDA ratio of 3.06x
Key Financials Q1 2018
Charles Bouaziz, Ontex CEO: “We have made a good start to 2018, demonstrating resilience as we navigate through a challenging environment. We delivered good volume growth, together with improved price/mix across all three categories. At the same time, ongoing cost savings helped us to achieve a sequential improvement in adjusted EBITDA margin in spite of raw material and FX pressures. We moved forward with our innovation and capex programs, and in Brazil continued developing plans to improve performance. The first quarter shows we are on track to achieve our 2018 priorities.”
Market Dynamics
Market conditions in early 2018 were largely unchanged compared to 2017: growth in the Adult Inco category is essentially offsetting a decline in Babycare category, and marginally lower Femcare category. Retailer brands performed well, and continue to represent a compelling alternative to international brands based on performance and price. The ongoing increase in the Adult Inco category across our markets, as well as retailer brands growing ahead of overall market growth, offer considerable future potential in which Ontex is very well positioned to benefit.
Raw material indices were materially higher in Q1 2018 compared to the same period in 2017 as anticipated. Based on current market information, a similar impact is expected for Q2 2018.
Nearly all of the currencies in which we have business were weaker versus the euro in Q1 2018.
Overview of Ontex Performance in Q1 2018
Our Q1 2018 performance was in line with our expectations, with Group revenue up 1.7% to €558.1 million. Good growth was achieved in Baby pants, as well as in the Adult Inco and Feminine Care categories. Divisional revenue performances were varied as expected, with solid growth in Growth Markets, Healthcare and Americas Retail. Group revenue increased due to both higher volumes and price/mix.
Adjusted EBITDA was €57.5 million in Q1 2018, and the adjusted EBITDA margin of 10.3% was a sequential improvement versus Q4 2017. This was in line with our expectations that the first half of 2018 would be lower than the same period of 2017. Savings and efficiency actions partly mitigated significant headwinds from raw materials and foreign exchange, as well as the dilutive impact of Brazil. We selectively invested in sales and marketing activities to support continued top-line growth.
OUTLOOK
Based on progress made in Q1 2018 we confirm our three priorities for 2018:
- continue investing in initiatives which will support sustainable profitable growth
- strengthen further the underlying Ontex business, continuing to build on our leadership position in retailer brands in Europe and on our portfolio of local brands
- achieve sustainable improvements in our Brazil business
Our market expectations remain unchanged: higher raw material costs, volatile and negative impact of FX, and pricing pressure especially in the Babycare category. In this environment, we continue to expect a low single-digit LFL revenue growth for 2018 in broadly flat hygiene markets. We anticipate that adjusted EBITDA margins in the first half of 2018 will be lower year on year, before sequentially improving as we progress through the second half. This evolution is expected as our actions across all aspects of the business, including pricing – which will result in some volume losses – mix and cost savings, increasingly take effect.
Operational Review: Categories
Babycare
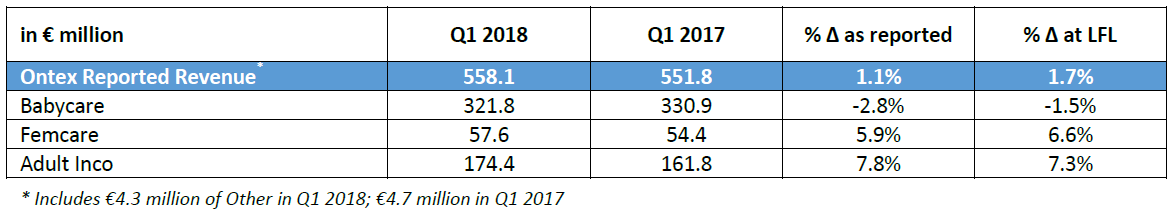
Babycare category revenue was 1.5% lower in Q1 2018, as Baby diapers remained under pricing pressure in several markets. Baby pants had strong volume growth, and we are investing to ensure we capture this opportunity with retail brands as well as with our own brands.
Femcare
Q1 2018 Femcare category revenue grew 6.6%, well ahead of underlying market category trends. New tampon business was the major driver of higher revenue.
Adult Inco
Revenue in the Adult Inco category was up 7.3% in Q1 2018, with growth in institutional channels, and retail sales up 9%. Consumer demand continued to drive strong growth of Adult pants.
Operational Review: Divisions
Mature Market Retail
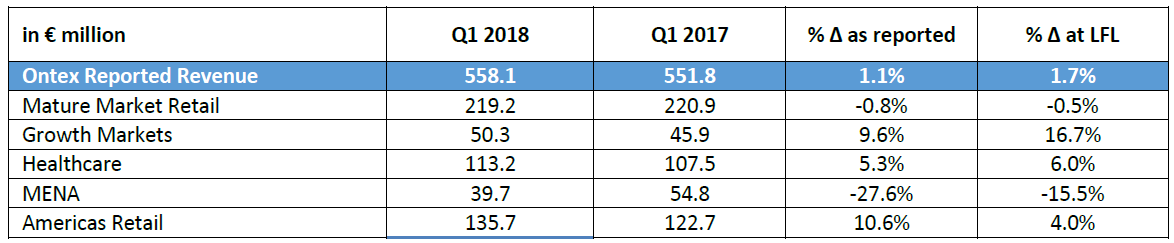
Following solid revenue growth in 2017 including strong sales in Q4, Q1 2018 Mature Market Retail revenue was 0.5% below last year. Overall volumes grew, and the Division delivered competitive revenue growth in Feminine Care and Adult Incontinence. Baby diaper revenue was lower, as some key customers adjusted their promotional schedule after their strong finish in 2017. We further enhanced our leading retail brand offering including new channel core technology in baby diapers. This innovation is supporting our customers to build differentiation through a shopper-based retail brand, increasing consumer loyalty in this key category.
Growth Markets
Growth Markets had a strong start to the year, up 16.7%. The Eastern European business grew in line with expectations, with higher sales in Russia despite fierce price pressure in the Baby Care category, particularly in branded products. Within this category, the shift from baby diapers to pants in Russia continued in Q1. High revenue growth outside of Eastern Europe was in part the result of a favorable comparable sales basis in Q1 2017, including in Ethiopia where the ramp-up of local production since mid-2017 progressed further, as well as some inventory building at customers ahead of seasonal demand. While these factors will impact Q2 2018, we anticipate outperforming our markets for the full year.
Healthcare
Revenue in the Healthcare Division was up 6.0% in Q1 2018, supported by new business as well as higher sales with our existing customers and some timing effects. Revenue growth was driven by higher volumes, while pricing remained under pressure in institutional channels. We continue to actively manage our business for sustainable profitability, and we are making good progress in self-pay channels. This portfolio management as well as price pressure have resulted in some contract losses which will impact the second half of the year, limiting the positive LFL revenue we expect for the full year.
MENA
Q1 2018 revenue in Middle East and North Africa Division was down 15.5% versus the highest quarter comparable base last year, essentially due to the Turkey Babycare category which remained challenging. Actions are continuing to improve our performance in this category, such as increased innovation and in-market activities. Our Adult Inco business in Turkey, based on the leading brand Canped, continued to perform well. Outside of Turkey, export sales were negatively impacted by a lack of customer liquidity, which is anticipated to result in sales shifting to Q2. As the comparable bases ease and our actions across the Division take hold, we anticipate returning to positive LFL revenue starting from Q2.
Americas Retail
Americas Retail Division revenue was 4.0% higher in Q1 2018, including 1 month of Ontex Brazil following the acquisition in March 2017. Excluding Brazil, revenue would have been up 7.4% compared to last year. Sales of baby diapers and Adult Inco products were higher in Mexico, based on our portfolio of local brands addressing consumer needs. Sales in Brazil were lower as expected; however, our team made good progress on executing our capex program and engaging with our customers on our innovation plans.
Operational Review: Geographies
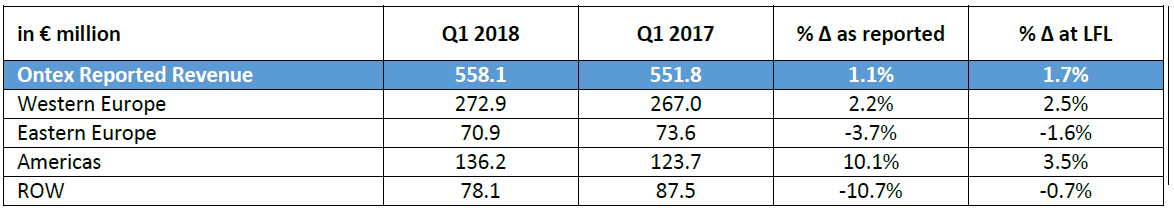
Revenue growth was achieved in Western Europe and the Americas, and sales outside of Western Europe were more than 50% of Group revenue.
Corporate information
The above press release and related financial information of Ontex Group NV for the three months ended March 31, 2018 was authorized for issue in accordance with a resolution of the Board on May 8, 2018.
Alternative Performance Measures
The following alternative performance measures (non-GAAP) have been included in this press release since management believes that they are widely used by certain investors, securities analysts and other interested parties as supplemental measures of performance and liquidity. The alternative performance measures may not be comparable to similarly titled measures of other companies and have limitations as analytical tools and should not be considered in isolation or as a substitute for analysis of our operating results, our performance or our liquidity under IFRS.
Like-for-like revenue (LFL)
Like-for-like revenue is defined as revenue at constant currency excluding change in perimeter of consolidation or M&A.
Non-recurring Income and expenses
Non-recurring income and expenses are those items that are considered by management not to relate to items in the ordinary course of activities of the Company. They are presented separately as they are important for the understanding of users of the consolidated financial statements of the “normal” performance of the company due to their size or nature. The non-recurring income and expenses relate to:
- Acquisition-related expenses;
- changes to the measurement of contingent considerations in the context of business combinations;
- business restructuring costs, including costs related to the liquidation of subsidiaries and the closure, opening or relocations of factories;
- asset impairment costs.
Non-recurring income and expenses of the Group are composed of the following items presented in the consolidated income statement as reported in the half-year condensed financial statements and the annual financial statements:
- Income/(expenses) related to changes to Group structure; and
- Income/(expenses) related to impairments and major litigations.
EBITDA and Adjusted EBITDA and related margins
EBITDA is defined as earnings before net finance cost, income taxes, depreciation and amortisation. Adjusted EBITDA is defined as EBITDA plus non-recurring income and expenses and excluding non-recurring impairment of assets. EBITDA and Adjusted EBITDA margins are EBITDA and Adjusted EBITDA divided by revenue.
Net financial debt/LTM Adjusted EBITDA ratio (Leverage)
Net financial debt is calculated by adding short-term and long-term debt and deducting cash and cash equivalents. LTM adjusted EBITDA is defined as EBITDA plus non-recurring income and expenses and excluding non-recurring impairment of assets for the last twelve months (LTM).
Conference call
Management will host a presentation for investors and analysts on May 9, 2018 at 9:00am BST/10:00am CEST.
A copy of the presentation slides will be available at: http://www.ontexglobal.com/financial-reports-including-annual-reviews
If you would like to participate in the conference call, please dial-in 5 to 10 minutes prior using the details below:
United Kingdom: +44 (0)330 336 9411
United States: +1 646 828 8143
Belgium: +32 (0)2 400 6926
France: +33 (0)1 76 77 22 57
Germany: +49 (0)69 2222 2018
Passcode: 2892573
A replay of the conference call will also be available for one week afterwards:
United Kingdom +44 (0) 207 660 0134
United States +1 719 457 0820
Belgium +32 (0) 2 620 0568
France +33 (0) 1 70 48 00 94
Germany +49 (0) 69 2000 1800
Passcode: 2892573
Financial calendar 2018
AGM May 25, 2018
H1 2018 July 26, 2018
Q3 2018 November 7, 2018
Contact
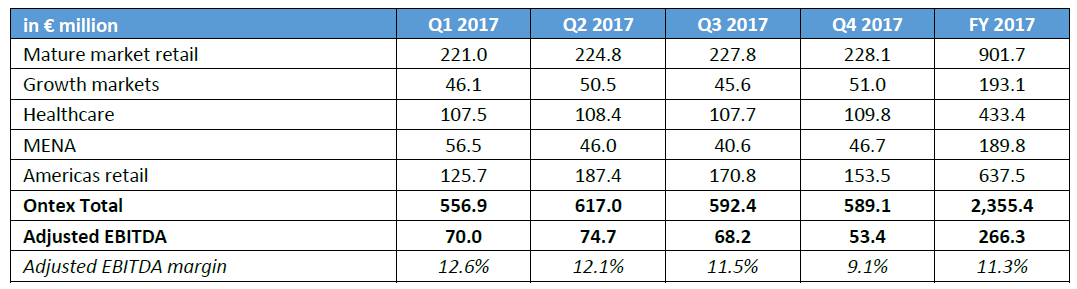
Revenue – 2017 as reported
Revenue – 2017 following application of IFRS 15
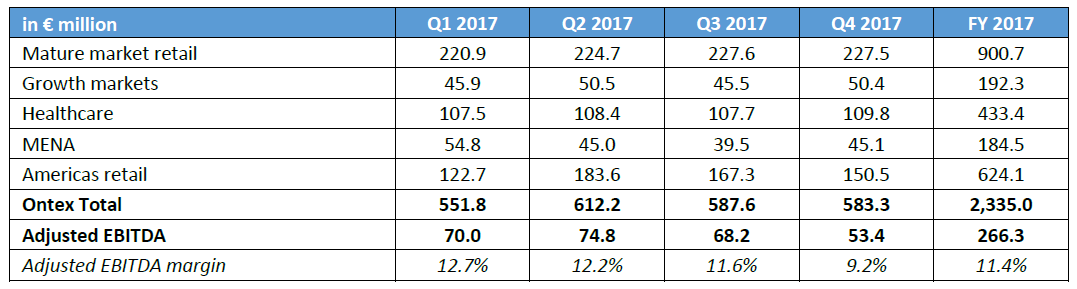
IFRS 15 Revenue from Contracts with Customers is endorsed by the EU and is to be applied for the reporting periods beginning on January 1, 2018. The Ontex Group is applying the new standard in its consolidated financial statements for the year ending December 31, 2018, and is applying the full retrospective approach of the standard.
DISCLAIMER
This trading update may include forward-looking statements. Forward-looking statements are statements regarding or based upon our management’s current intentions, beliefs or expectations relating to, among other things, Ontex’s future results of operations, financial condition, liquidity, prospects, growth, strategies or developments in the industry in which we operate. By their nature, forward-looking statements are subject to risks, uncertainties and assumptions that could cause actual results or future events to differ materially from those expressed or implied thereby. These risks, uncertainties and assumptions could adversely affect the outcome and financial effects of the plans and events described herein.
Forward-looking statements contained in this trading update regarding trends or current activities should not be taken as a report that such trends or activities will continue in the future. We undertake no obligation to update or revise any forward-looking statements, whether as a result of new information, future events or otherwise. You should not place undue reliance on any such forward-looking statements, which speak only as of the date of this trading update.
The information contained in this trading update is subject to change without notice. No re-report or warranty, express or implied, is made as to the fairness, accuracy, reasonableness or completeness of the information contained herein and no reliance should be placed on it.
In most of the tables of this trading update, amounts are shown in € million for reasons of transparency. This may give rise to rounding differences in the tables presented in the trading update.
This trading update has been prepared in Dutch and translated into English. In the case of discrepancies between the two versions, the Dutch version will prevail.