- Q3 LFL revenue ex Brazil +3%, outperforming flat hygiene markets
- Continuous focus on value: price/mix +2.9%
- Important milestones achieved in Brazil turnaround
Aalst-Erembodegem, November 7, 2018 – Ontex Group NV (Euronext Brussels: ONTEX; ‘Ontex,’ ‘the Group’ or ‘the Company’) today announced its results for the nine-month period ended September 30, 2018.
Q3 2018 Financial Highlights
- Like-for-like (LFL) revenue grew 3.0% ex Brazil driven by positive price/mix
- Solid LFL growth in Adult Inco; baby pants up double digits
- Brazil revenue improved sequentially ex foreign exchange (FX): Q3 +5% versus Q2
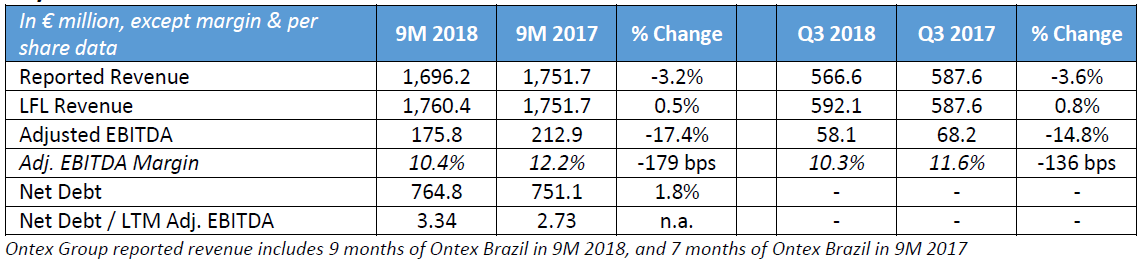
- LFL Group revenue up 0.8%; FX headwind of €25.5 million
- Adjusted EBITDA of €58.1 million, Adjusted EBITDA margin of 10.3% (11.0% ex Brazil);
- Positive price/mix in all Divisions and categories
- Continued delivery of savings and efficiencies
- Brazil positive Adjusted EBITDA; sequential improvement each quarter since Q4 2017
- Higher raw material costs and FX headwind of €4.9 million weighed on margins
Q3 2018 Operational Highlights
- New production Baby and Adult pants capacity underpinned acceleration of price/mix
- Strong growth in North America driven by new business
- Relaunched Pom Pom diaper in Brazil with premium ultra-thin core
- Transferred and consolidated production onto one site in Brazil
Key Financials 9M 2018 and Q3 2018
Charles Bouaziz, Ontex CEO: “The steps we are taking to achieve a more balanced top and bottom line are working. LFL revenue improved, driven by positive price/mix in all Divisions and categories. The top line contribution and our ongoing focus on savings has largely offset input costs and negative FX. While it is disappointing that the benefits of our actions are currently being masked by these external factors, we remain focused on executing our 2018 priorities and developing a comprehensive review to accelerate the delivery of value for the benefit of our shareholders, which we will announce at the time of our 2018 results.”
Market Dynamics
Hygiene markets remained broadly stable compared to a year ago. In the third quarter, babycare category value decreased at a similar rate to the first half, however with a modest improvement in market pricing while volumes were lower. The proportion of retailer brands in our markets were at similar levels versus last year, highlighting their inherent attractiveness to retail customers as well as consumers.
On a year-on-year basis, most commodity raw material indices were higher, in some cases materially, in Q3 2018. Based on current information this is expected to continue in Q4 2018.
The majority of currencies we do business in were lower versus the euro during Q3 2018, continuing the trend seen in the first half of the year.
OUTLOOK
Based on our year-to-date revenue performance, we remain on track to record low single-digit LFL growth for the full year 2018 in broadly flat hygiene markets. Actions to enhance price/mix and cost saving initiatives will continue and further value-creating actions will be considered as required, in light of sustained input cost pressures and FX volatility. We expect Q4 2018 Adjusted EBITDA margin to be broadly similar to that in 9M 2018.
Operational Review: Categories
Babycare
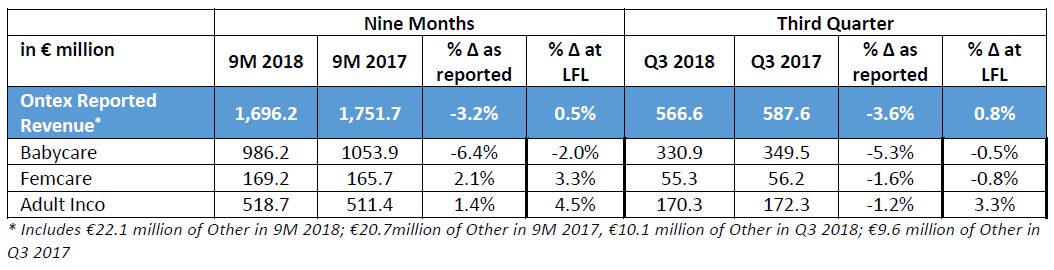
Babycare category revenue saw a slight decrease of 0.5% in Q3 2018. Baby pants revenue accelerated further in Q3, up double digits supported by growth in all main markets. Baby diapers had competitive growth in several of our markets outside Brazil.
Femcare
Revenue in the Femcare category in Q3 2018 was 0.8% lower, with growth of organic cotton tampon sales remaining high.
Adult Inco
In Q3 2018, Adult Inco category revenue was up 3.3%, with sales in retail channels 8% higher and stable in institutional channels. Sales of Adult Pants and Light Inco products continued to drive our revenue in this category.
Operational Review: Divisions
Mature Market Retail
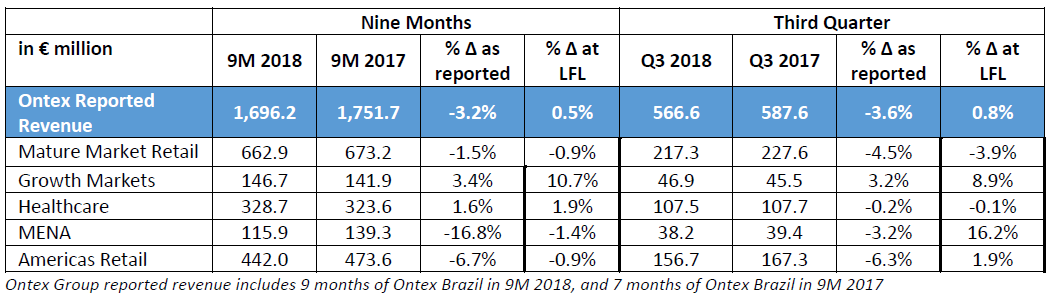
Against a high prior year comparable, Q3 2018 Mature Markets Retail Division revenue was 3.9% lower. Following strong, volume-led revenue growth in 2017 and a continuous and material rise in Group input costs, we increased our efforts to improve the contribution from price and mix in 2018. Year-on-year pricing was positive in Q3, reflecting the broad-based price increases designed to partly offset significant Group-wide input cost growth, particularly in raw materials and energy. As expected, sales volumes were negatively affected by these price increases, in an environment where the international branded diaper competitor has maintained an aggressive pricing policy and promotional activity. Product mix was positively impacted by ongoing volume gains in Baby Pants and Adult Incontinence, as new production capacity to support our customers continued to ramp up. We also continued rolling out our new channel core diapers to leading retailer customers, helping them to attract consumers to their stores.
Growth Markets
The Growth Markets Division delivered a solid revenue performance in Q3 2018, increasing 8.9%. Higher volumes and positive price/mix underpinned the revenue growth, which continued to be broad-based across most categories and geographies. In spite of ongoing rising Group input costs and weaker currency, the competitive environment remains challenging with all Babycare suppliers maintaining a high level of pricing and promotional activity to gain share. Our focus to develop local production capabilities and leverage the Company’s deep experience in retailer brands supported market outperformance in the Division.
Healthcare
Q3 2018 Healthcare Division revenue was essentially unchanged versus last year, down 0.1%. The sales mix benefited from the growth of Adult Pants and Light Inco products in most markets, which offset a slight decrease in volumes across other products. In light of sustained input cost inflation we will continue to implement efficiency measures and actively manage our customer and product portfolio.
MENA
Revenue in our Middle East and North Africa Division grew 16.2% in Q3 2018, demonstrating that our actions are delivering results. Despite heightened competition in Babycare, Division sales rose due to both higher volumes and positive price/mix. In Turkey, we benefited from our recently launched Canbebe baby diaper innovation supported by increased in-store activation and digital engagement with consumers, and further growth in Adult Inco, together with pricing actions in light of local currency weakness. We also had good growth in other markets including export sales.
Americas Retail
Americas Retail Division had 1.9% revenue growth in Q3 2018, on top of a solid comparable revenue performance last year. Outside Brazil, revenue was up 14.2%, as our portfolio of local Babycare and Adult Inco brands in Mexico continued to perform well, and sales in the US accelerated due to strong Babycare and Femcare sales. In Brazil, we relaunched an enhanced Pom Pom diaper, with positive initial consumer feedback, following the relaunch of our Cremer diaper brand a few months earlier. Our team also successfully finalized the consolidation of production onto one site in Brazil, previously announced in May 2018, which includes new proprietary technology that will support our future growth plans. In addition to these operational milestones, we delivered further sequential revenue growth in Q3 2018 of 5% excluding FX versus Q2 2018, and positive adjusted EBITDA. The progress to date confirms that our comprehensive turnaround plan in Brazil is slowly but surely taking effect.
Operational Review: Geographies
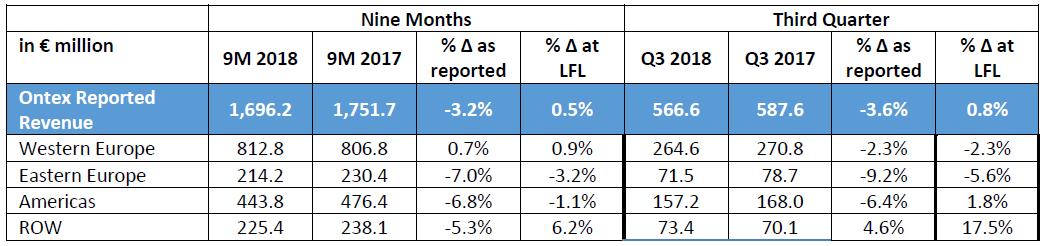
Q3 2018 revenue was driven by an increase outside of Europe, despite significant FX headwinds. The majority of Group reported revenue was from outside of Western Europe, in markets which are forecast to continue growing in the mid- to long-term.
Corporate information
The above press release and related financial information of Ontex Group NV for the nine months ended September 30, 2018 was authorized for issue in accordance with a resolution of the Board of Directors on November 6, 2018.
Alternative Performance Measures
The following alternative performance measures (non-GAAP) have been included in this trading update since management believes that they are widely used by certain investors, securities analysts and other interested parties as supplemental measures of performance and liquidity. The alternative performance measures may not be comparable to similarly titled measures of other companies and have limitations as analytical tools and should not be considered in isolation or as a substitute for analysis of our operating results, our performance or our liquidity under IFRS.
Like-for-like revenue (LFL)
Like-for-like revenue is defined as revenue at constant currency excluding change in perimeter of consolidation or M&A.
Non-recurring Income and expenses: Non-recurring income and expenses are those items that are considered by management not to relate to items in the ordinary course of activities of the Company. They are presented separately as they are important for the understanding of users of the consolidated financial statements of the “normal” performance of the company due to their size or nature. The non-recurring income and expenses relate to:
• Acquisition-related expenses;
• changes to the measurement of contingent considerations in the context of business combinations;
• business restructuring costs, including costs related to the liquidation of subsidiaries and the closure, opening or relocations of factories;
• asset impairment costs.
EBITDA and Adjusted EBITDA and related margins
EBITDA is defined as earnings before net finance cost, income taxes, depreciation and amortisation. Adjusted EBITDA is defined as EBITDA plus non-recurring income and expenses. EBITDA and Adjusted EBITDA margins are EBITDA and Adjusted EBITDA divided by revenue.
Net financial debt/LTM Adjusted EBITDA ratio (Leverage)
Net financial debt is calculated by adding short-term and long-term debt and deducting cash and cash equivalents. LTM adjusted EBITDA is defined as EBITDA plus non-recurring income and expenses for the last twelve months (LTM).
Conference call
Management will host a presentation for investors and analysts on November 7, 2018 at 8:00am GMT/9:00am CET. A copy of the presentation slides will be available at:
http://www.ontexglobal.com/financial-reports-including-annual-reviews
If you would like to participate in the conference call, please dial-in 5 to 10 minutes prior using the details below:
United Kingdom +44 (0)330 336 9127
United States +1 323 994 2093
Belgium +32 (0)2 404 0659
France +33 (0)1 76 77 22 88
Germany +49 (0)69 2222 25574
Passcode 8636712
A replay of the conference call will also be available for one week afterwards:
United Kingdom +44 (0) 207 660 0134
United States +1 719 457 0820
Belgium +32 (0) 2 620 0568
France +33 (0) 1 70 48 00 94
Germany +49 (0) 69 2000 1800
Passcode 8636712
Financial calendar 2019
FY 2018 March 8, 2019
Q1 2019 May 8, 2019
AGM May 24, 2019
H1 2019 July 31, 2019
Q3 2019 November 6, 2019
Contact
DISCLAIMER
This trading update may include forward-looking statements. Forward-looking statements are statements regarding or based upon our management’s current intentions, beliefs or expectations relating to, among other things, Ontex’s future results of operations, financial condition, liquidity, prospects, growth, strategies or developments in the industry in which we operate. By their nature, forward-looking statements are subject to risks, uncertainties and assumptions that could cause actual results or future events to differ materially from those expressed or implied thereby. These risks, uncertainties and assumptions could adversely affect the outcome and financial effects of the plans and events described herein.
Forward-looking statements contained in this trading update regarding trends or current activities should not be taken as a report that such trends or activities will continue in the future. We undertake no obligation to update or revise any forward-looking statements, whether as a result of new information, future events or otherwise. You should not place undue reliance on any such forward-looking statements, which speak only as of the date of this report.
The information contained in this trading update is subject to change without notice. No re-report or warranty, express or implied, is made as to the fairness, accuracy, reasonableness or completeness of the information contained herein and no reliance should be placed on it.
In most of the tables of this trading update, amounts are shown in € million for reasons of transparency. This may give rise to rounding differences in the tables presented in the trading update.
This trading update has been prepared in Dutch and translated into English. In the case of discrepancies between the two versions, the Dutch version will prevail.