- Reported revenue up 22%: LFL revenue growth in all 5 Divisions and 3 categories
- Including Ontex Brazil, Q2 revenue confirmed annualized run-rate of €2.4 billion
- Higher raw materials resulting in a lower Adjusted EBITDA margin; higher Adjusted EPS
Aalst-Erembodegem, July 27, 2017 – Ontex Group NV (Euronext Brussels: ONTEX; ‘Ontex,’ ‘the Group’ or ‘the Company’) today announced its results for the six-month period ended June 30, 2017.
H1 2017 Highlights
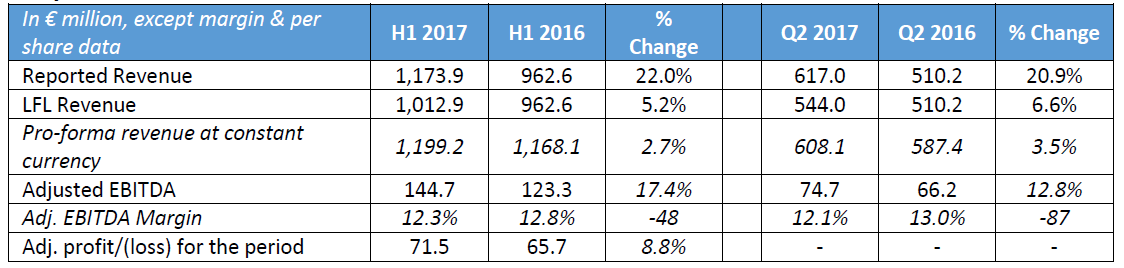
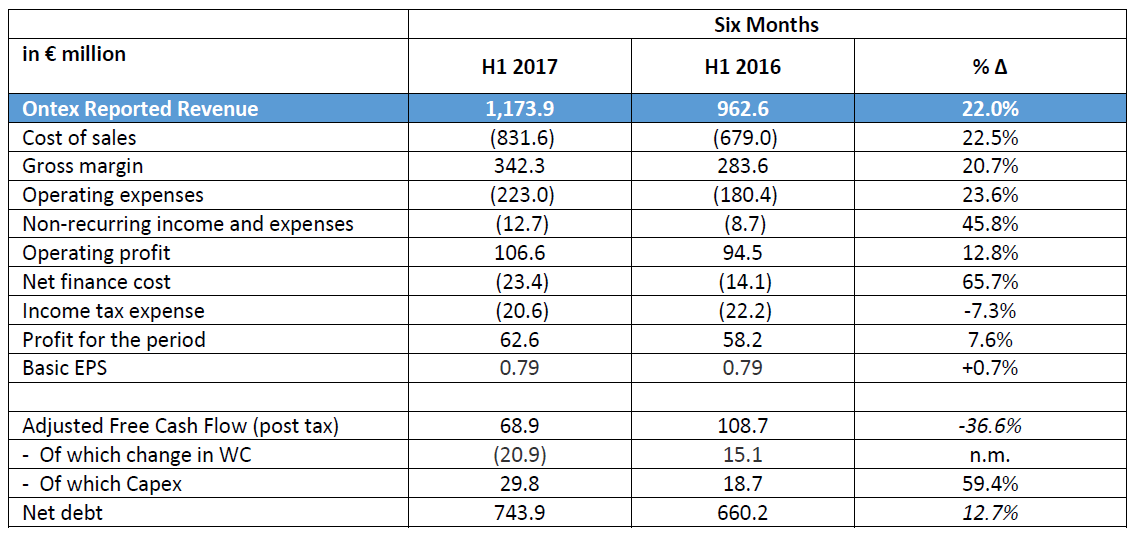
- Revenue was €1.17 billion, up 22.0% on a reported basis
- +5.2% on a like-for-like (LFL) basis, year-on-year (yoy)
- +2.7% pro-forma at constant currency
- Adjusted EBITDA increased by 17.4% yoy to €144.7 million, leading to an Adjusted EBITDA margin of 12.3%
- Net foreign exchange (FX) impacts of -€0.5 million on revenue and -€0.2 million on Adjusted EBITDA
- Adjusted net profit of €71.5 million was up 8.8% yoy; Adjusted earnings per share was €0.90, ahead of last year on 10% higher share count following successful capital increase in March 2017
- Net Debt was €743.9 million as of June 30, 2017, including €33.0 million of acquisition-related earn-outs, resulting in a net debt/LTM Adjusted EBITDA ratio of 2.75x
Q2 2017 Highlights
- Revenue of €617.0 million was up 20.9% on a reported basis
- +6.6% on a LFL basis
- +3.5% pro-forma at constant currency
- Adjusted EBITDA of €74.7 million was 12.8% higher yoy, Adjusted EBITDA margin of 12.1%
- Net FX impacts of +€1.4 million on revenue and +€2.3 million on Adjusted EBITDA
Key Financials H1 2017 and Q2 2017

Charles Bouaziz, Ontex CEO: “This is a very strong first half of 2017. We delivered a solid LFL revenue performance, particularly in our two largest Divisions, confirming the return of Mature Market Retail to solid growth and accelerating in our Americas Retail Division. One side effect of our high growth is temporary pressure on our manufacturing and supply chain, which along with rising input costs has contributed to short-term margin pressure. As we address these issues, we remain focused on capturing long-term profitable growth opportunities.
“Together with the integration of Ontex Brazil, which is on track with our expectations, we continue our transformation from an operations-focused organization to an international consumer goods company.”
Market Dynamics
Market growth for the Babycare, Femcare and Adult Incontinence categories in the first four months of 2017 has been below the full year forecast. Notably, retailer brands continued their progress in the markets of our Mature Market Retail Division, where the volume share of retailer brands surpassed the leading international diaper brand for the first time in history. The Adult Inco category confirmed its status as the growth driver in all markets where Ontex is active.
Foreign exchange rates were volatile in H1 2017; in particular, the British Pound, Mexican Peso, Russian Rouble, Turkish Lira and Brazilian Real.
As anticipated, indices of our main commodity raw materials increased in the first half of 2017 compared to the same period of 2016, primarily in the second quarter.
Outlook
We expect to grow revenue ahead of our markets for full year 2017. Our recent acquisition of Ontex Brazil is anticipated to perform in line with our expectations for 2017. Foreign exchange rates are expected to remain volatile in the second half of the year. Based on current market information, we expect that prices for our main commodity raw materials will continue to be a headwind for the rest of 2017 compared to the previous year. We continue to take actions to mitigate these headwinds, which are expected to improve margins over time.
Overview of Ontex Performance in H1 2017
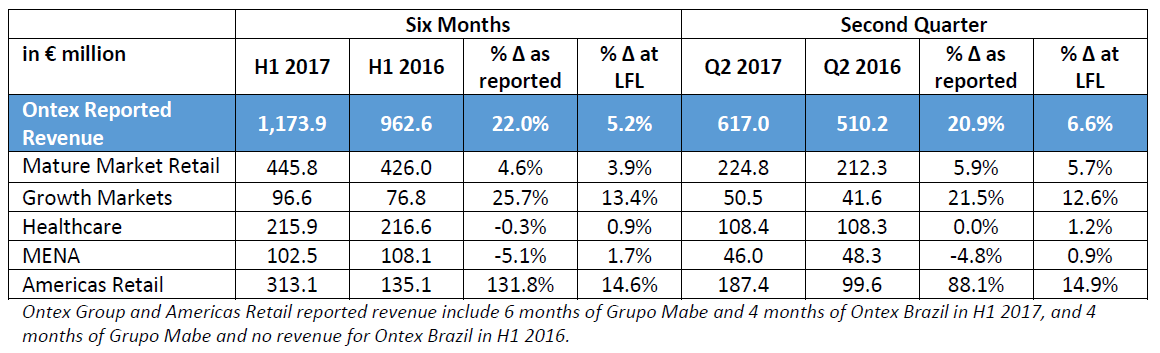
Group revenue in H1 2017 totaled €1.17 billion. Revenue grew by 22.0% on a reported basis versus prior year, including four months’ contribution from the acquisition of Ontex Brazil. On a LFL basis, revenue was up +5.2%; all five Divisions and all three categories contributed to this growth.
H1 2017 Adjusted EBITDA was €144.7 million, an increase of 17.4% year on year, resulting in an adjusted EBITDA margin of 12.3%.
Operational Review: Divisions
Mature Market Retail
Revenue in our Mature Markets Retail Division recorded a solid performance in H1 2017, up 3.9% on a LFL basis versus a year ago. Division revenue continued to benefit from new business gained in all three categories, in addition to growth in our existing business. Increased volumes drove revenue higher across a majority of our markets, and this was achieved despite ongoing price pressures in the Babycare category, primarily from the leading international brand. Based on shopper insights, we will continue to improve our products and services so that leading retailers continue to compete effectively with their own brands.
Growth Markets
H1 2017 revenue in the Growth Markets Division rose 13.4% on a LFL basis. This strong result was due to higher volumes, including in the highly competitive Russian market, where retailer brands continued their positive evolution. Additionally, a new production site was formally opened in Ethiopia in July 2017. The advanced production technology at this site will allow us to better serve consumers in East Africa with Canbebe branded diapers, tailored to meet their specific local needs.
Healthcare
Healthcare Divisional revenue in H1 2017 rose 0.9% on a LFL basis versus the same period last year. The sales growth is due to increased volumes, while pricing remained under pressure. We continued to implement our strategy of generating profitable growth in a stable to slightly declining market, by helping customers meet their business objectives thanks to our focus on product and channel mix, enhanced service and cost control.
MENA
Revenue in the Middle East and North Africa Division was up 1.7% in H1 2017 compared to last year on a LFL basis. Market conditions have been weaker than expected, particularly in the Turkey diaper category, where consumer confidence remained cautious and sales of low-price products grew strongly. The leading brands in the category, including our Canbebe diaper brand, were all impacted by these factors. The Adult Inco category in Turkey continued to grow, and our Canped brand extended further its market-leading position. Divisional sales were also impacted by liquidity issues in some export markets. We are implementing measures to improve our revenue performance in this Division.
Americas Retail
H1 2017 Americas Retail Division revenue was 14.6% higher than a year ago on a LFL basis. The solid LFL revenue performance was the result of market share gains in Mexico in both the Babycare and Adult Inco categories, and increased sales in the US. The Brazilian personal hygiene market was challenging as expected, with lower sales in the Babycare category, while the Adult Inco category grew. Importantly, we have made considerable progress on our integration plan in the 4 months since completing the acquisition, including moving forward on upgrading our manufacturing capabilities, which is a key element to drive long-term performance.
Operational Review: Categories
Babycare
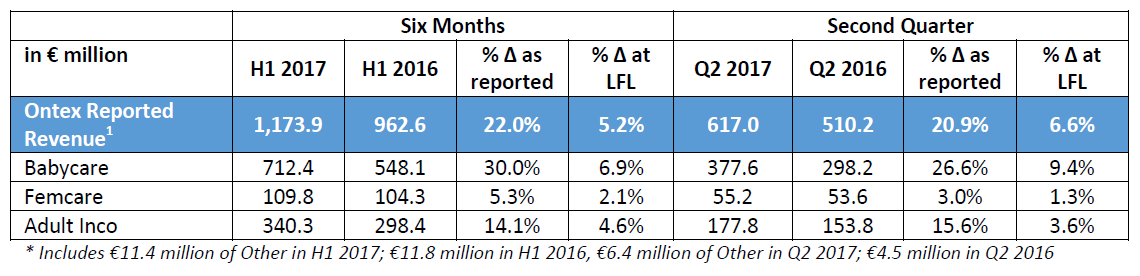
Babycare category revenue grew 30.0% on a reported basis in H1 2017, which included Grupo Mabe and Ontex Brazil, and a 6.9% increase on a LFL basis, thanks to higher sales in the majority of our markets.
Femcare
Revenue in the Femcare category in H1 2017 was 5.3% higher as reported, and up 2.1% on a LFL basis. Essentially all of the LFL growth was in Western Europe, the region in which most of our sales take place.
Adult Inco
H1 2017 Adult Inco category revenue rose 14.1% on a reported basis, and increased 4.6% on a LFL basis. Adult Inco sales in retail channels were 9% higher year-on-year, and in institutional channels revenue also grew, both on a LFL basis.
Operational Review: Geographies
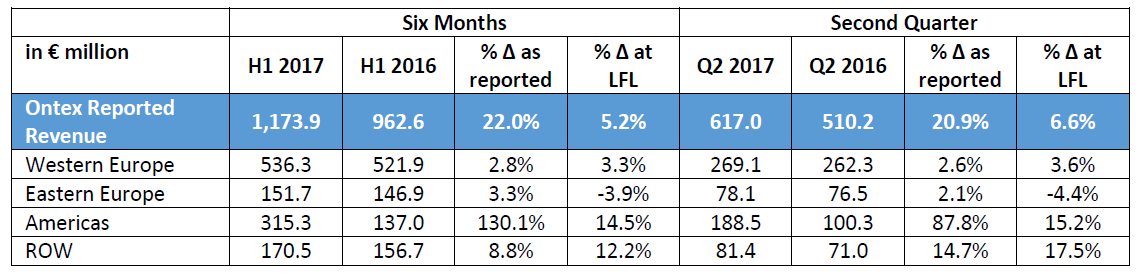
H1 2017 sales in Western Europe represented 46% of Group revenue, despite recording higher revenue in this region. The majority of Group revenue was generated outside of Western Europe, mostly in developing markets, which reflects the significant re-balancing of Ontex’s geographic presence that has occurred since the IPO in 2014.
Financial Review
Selected Financial Information
Gross Margin
H1 2017 Gross margin amounted to €342.3 million, up 20.7% year on year. Gross margin as a percentage of sales was 30 basis points lower, moving from 29.5% in H1 2016 to 29.2% in H1 2017. Our savings and efficiency actions delivered further improvements, and gross margin was also positively impacted by strong volume growth across the business. On the other hand, the tension in our manufacturing and supply chain, coupled with increased raw material costs and change in business mix from acquisitions, led to a lower gross margin as a percentage of sales.
Adjusted EBITDA
Adjusted EBITDA was up 17.4% to €144.7 million in H1 2017. Next to the evolution of gross margin as explained above, the strong revenue increase resulted in higher distribution expenses.
We continued investing in our commercial capabilities, which should strengthen future revenue growth.
Foreign Exchange
The foreign exchange impact on revenue and Adjusted EBITDA was essentially neutral at Group level for H1 2017. Changes in foreign exchange rates led to a -€0.5 million impact on revenue and -€0.2 million impact on Adjusted EBITDA, as appreciation of the Russian Ruble was mostly offset by weaker Turkish Lira, British Pound and Mexican Peso. In addition, the Brazilian Real has weakened compared to the Euro, impacting the translation of Ontex Brazil’s results. This is not included in the calculations above as we did not have activities in Brazilian Real in 2016.
Net Finance Costs
H1 2017 net finance costs amounted to €23.4 million, an increase of €9.3 million compared to the same period of 2016. This increase is mostly explained by the net negative impact of exchange rate differences related to financing activities in 2017, compared to a net positive FX impact last year. H1 2017 net interest expenses were in line with last year.
Income Tax Expense
The income tax expense in H1 2017 was €20.6 million. The resulting effective tax rate was 24.8%, in line with the company’s expectation of an effective tax rate in the mid-20s.
Working Capital
Working capital as a percentage of revenue was 11.7%, within our target to keep at 12% of lower. By comparison, H1 2016 working capital was lower, due to the sale of a VAT receivable in Italy.
Capex
Capital expenditure totalled €29.8 million in the first half of 2017, in part explained by increased investment in our acquisitions in Mexico and Brazil. For the full year 2017, we anticipate capex to be around 5% of sales, with the increase versus 2016 due to the capex program foreseen as part of the acquisition of Ontex Brazil. This program should generate operational synergies starting in 2018, and allow for more product innovation.
Adjusted Free Cash Flow (post tax)
H1 2017 Adjusted free cash flow (post tax) was €68.9 million. The decrease versus last year is mainly due to the significant build-up of working capital in Ontex Brazil. The carved-out company, which became operational in January 2017, did not receive historical receivables from Hypermarcas. This effect was fully expected and was factored into the cash consideration. Cash taxes paid also increased in H1 2017 compared to a year ago, mainly due to higher advanced tax payments the company decided to make, following changes in interest rates applied by tax authorities.
Net debt
Net debt was €743.9 million at June 30, 2017, with net leverage based on the last twelve months Adjusted EBITDA of 2.75x.
Corporate information
The above press release and related financial information of Ontex Group NV for the three and six months ended June 30, 2017 was authorized for issue in accordance with a resolution of the Board on July 26, 2017.
Alternative Performance Measures
The following alternative performance measures (non-GAAP) have been included in this press release since management believes that they are widely used by certain investors, securities analysts and other interested parties as supplemental measures of performance and liquidity. The alternative performance measures may not be comparable to similarly titled measures of other companies and have limitations as analytical tools and should not be considered in isolation or as a substitute for analysis of our operating results, our performance or our liquidity under IFRS.
Like-for-like revenue (LFL)
Like-for-like revenue is defined as revenue at constant currency excluding change in perimeter of consolidation or M&A.
Pro-forma revenue
Pro-forma revenue includes 6 months of Mabe and Ontex Brazil in both H1 2017 and H1 2016. Pro-forma revenue at constant currency is pro-forma revenue excluding FX.
Non-recurring Income and expenses
Non-recurring income and expenses are those items that are considered by management not to relate to items in the ordinary course of activities of the Company. They are presented separately as they are important for the understanding of users of the consolidated financial statements of the “normal” performance of the company due to their size or nature. The non-recurring income and expenses relate to:
- Acquisition-related expenses;
- changes to the measurement of contingent considerations in the context of business combinations;
- business restructuring costs, including costs related to the liquidation of subsidiaries and the closure, opening or relocations of factories;
- asset impairment costs.
EBITDA and Adjusted EBITDA and related margins
EBITDA is defined as earnings before net finance cost, income taxes, depreciation and amortisation. Adjusted EBITDA is defined as EBITDA plus non-recurring income and expenses and excluding non-recurring impairment of assets. EBITDA and Adjusted EBITDA margins are EBITDA and Adjusted EBITDA divided by revenue.
Net financial debt/LTM Adjusted EBITDA ratio (Leverage)
Net financial debt is calculated by adding short-term and long-term debt and deducting cash and cash equivalents. LTM adjusted EBITDA is defined as EBITDA plus non-recurring income and expenses and excluding non-recurring impairment of assets for the last twelve months (LTM).
Adjusted Free Cash Flow
Adjusted Free Cash Flow is defined as Adjusted EBITDA less capital expenditures (Capex, defined as purchases of property, plant and equipment and intangibles), less change in working capital, less cash taxes paid.
Adjusted Profit & Adjusted EPS (earnings per share)
Adjusted Profit is defined as profit for the period plus non-recurring income and expenses and tax effect on non-recurring income and expenses, attributable to the owners of the parent. Adjusted EPS is Adjusted Profit divided by the weighted average number of ordinary shares.
Working Capital
The components of our working capital are inventories plus trade and other receivables and prepaid expenses plus trade and other payables and accrued expenses.
Conference call
Management will host a presentation for investors and analysts on July 27, 2017 at 8:00am BST/9:00am CEST. A copy of the presentation slides will be available at:
http://www.ontexglobal.com/financial-reports-including-annual-reviews
If you would like to participate in the conference call, please dial-in 5 to 10 minutes prior using the details below:
United Kingdom: +44 (0)330 336 9105
United States: +1 323 794 2093
Belgium: +32 (0)2 404 0659
France: +33 (0)1 76 77 22 74
Germany: +49 (0)69 2222 13420
Passcode: 9972765
Financial calendar 2017
Q3 2017 November 8, 2017
Contact