- Reported Revenue: €2,281 million (-1.0% LFL) – Solid revenue growth in AMEAA largely offset lower sales in Europe
- Adjusted EBITDA: €245 million (€261 million at constant currencies), with acceleration in Q4, reflecting initial benefits of Transform to Grow (T2G) program and raw material indices starting to ease
- Strong free cash flow: €110 million, +51%, driving net debt down by €46 million when compared with PY end
- T2G making Ontex more competitive and profitable: Adjusted EBITDA expected to improve to €270/€275 million in 2020 from €245 million in 2019
Aalst-Erembodegem, March 4, 2020 – Ontex Group NV (Euronext Brussels: ONTEX) today announced its results for the twelve months ending December 31, 2019.
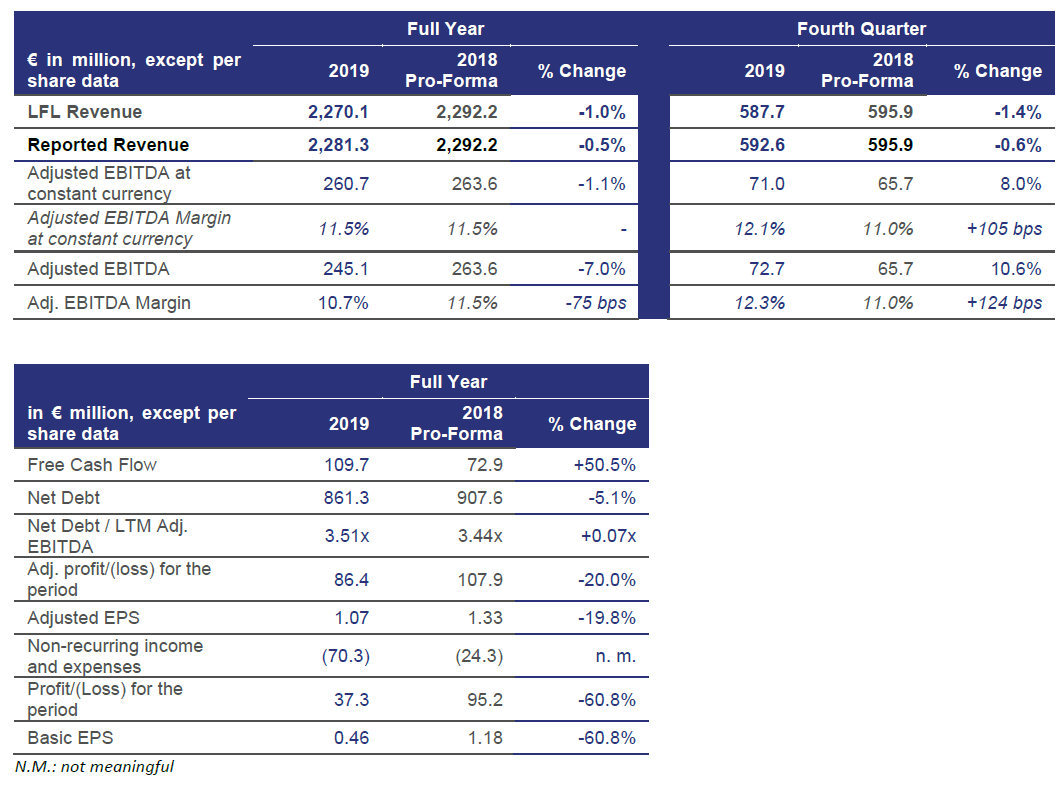
- Revenue of €2,270 million at constant currencies, down 1.0% like-for-like (LFL) versus FY 2018
- Positive price/mix in all categories and Divisions largely offset lower volumes
- Revenue of €2,281 million at reported currencies, down 0.5% versus FY 2018
- Adjusted EBITDA of €261 million at constant currencies, down 1.1% versus FY 2018
- Stable Adjusted EBITDA margin at constant currencies: 11.5%
- Adjusted EBITDA of €245 million at reported currencies, margin of 10.7%
- Q4 Adjusted EBITDA up 8% at constant currencies, margin of 12.1% (+105 bps)
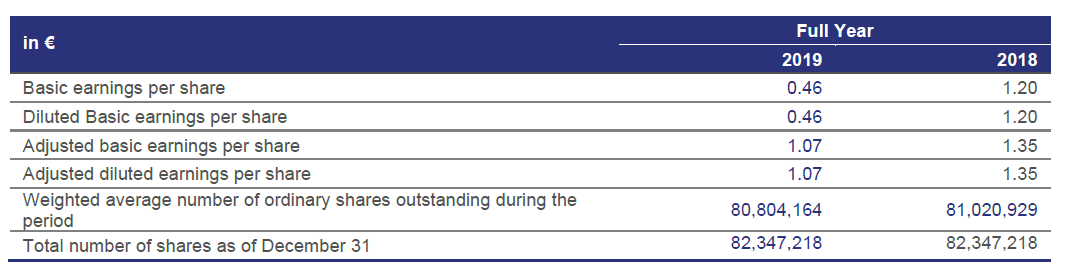
- Adjusted EPS: €1.07 vs €1.33 mainly due to negative currency impacts
- Proposed gross dividend: €0.16 per share, in line with Ontex’s policy to pay out 35% of net profit
Management comment
Charles Bouaziz, Ontex CEO, said: “Our 2019 revenue and operating profitability were broadly in line with our expectations, despite the anticipated temporary slow-down of our business in Europe and persistent high raw material costs in the first three quarters.
We are encouraged by the meaningful improvement of our operating profitability in the fourth quarter of 2019, which reflects the first benefits from our Transform to Grow program as it continues to ramp up, and easing raw materials indices. We are also pleased by the strong cash flow generation across the past year which exceeded our objectives, supported by T2G initiatives. All efforts are being made to ensure these gains will further materialize across 2020, resulting in an expected significant improvement in adjusted EBITDA this year.
We are making significant progress on our strategic growth pillars. Today we are announcing investment in local manufacturing capacity in the US following recent business gains, in order to better serve our growing customer base. We are also stepping up investments in innovation, information technology and marketing to further strengthen the company’s long-term competitiveness and growth potential, to create value for our stakeholders.”
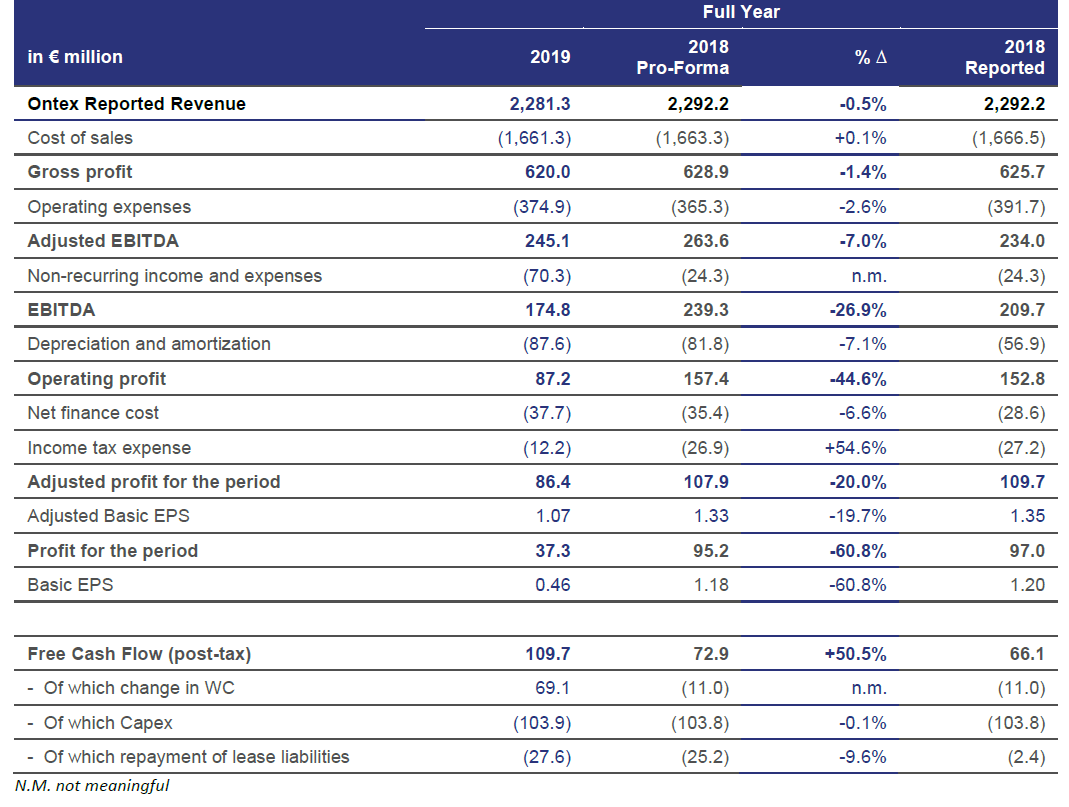
Key Financials for FY 2019 and Q4 2019
Notes which apply to this document
Unless otherwise indicated, all comments in this document on changes in revenue are on a like-for-like basis (at constant currencies).
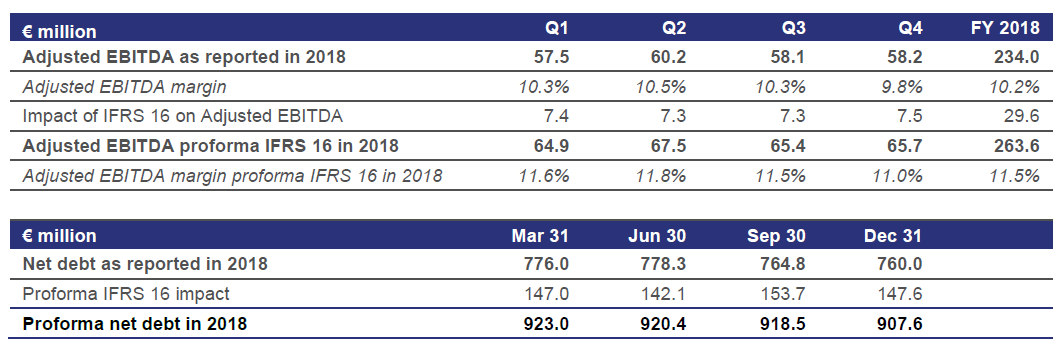
Unaudited Q4 and FY 2018 financial data have been provided on a pro forma basis for IFRS 16 Leases following adoption of this accounting standard since January 2019. This additional information has been provided to facilitate comparisons and understanding of the Group’s underlying performance.
Definitions of Alternative Performance Measures (APMs) in this document can be found under the section Corporate Information.
Due to rounding, numbers presented throughout this press release may not add up precisely to the totals provided and percentages may not precisely reflect the absolute figures.
Reduction in Net debt
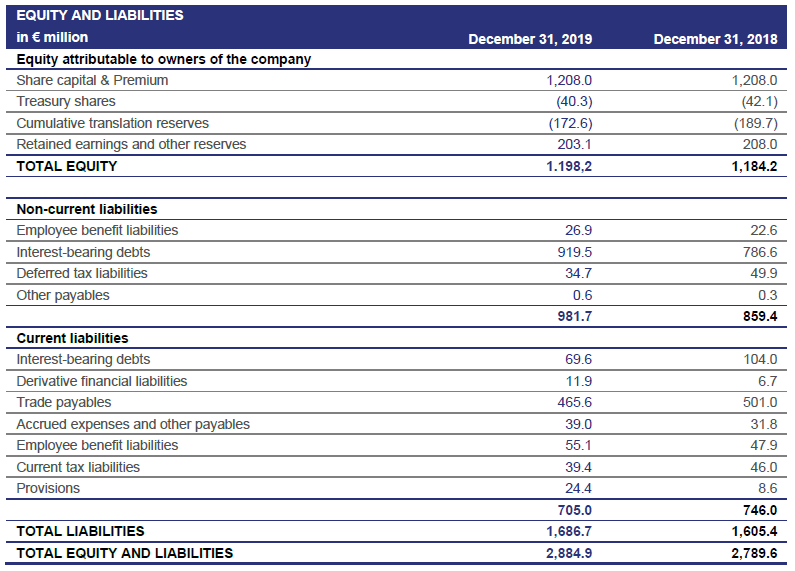
Net debt stood at €861.3 million at December 31, 2019, down €37.5 million compared with June 30, 2019, and down €46.3 million compared with December 31, 2018 (pro forma for IFRS 16). Leverage was 3.51x at December 31, 2019, lower than the 3.71x reported at June 30, 2019 and only marginally higher than one year ago (pro forma for IFRS 16). We remained fully compliant with the leverage covenant of our financing agreements, and headroom improved over H2.
Transform to Grow (T2G) program on track to significantly step up competitiveness and profitability
T2G was launched in May 2019 with the objective of step-changing our operational efficiency and commercial practices, making Ontex a stronger and more profitable company, delivering growth and creating value for all stakeholders.
Implementation of T2G is well on-track with more than 55% of the initiatives well underway. Initial tangible results are already visible and contributed to the improvement of Adjusted EBITDA throughout the second half of 2019.
These implemented initiatives include:
- Pilots of our new shopfloor model rolled out in 4 production sites, upgrading capabilities and improving productivity;
- Implementation of a new warehouse management system well underway, leading to more cost-effective in-sourcing of storage and exiting from 9 external warehouses;
- New practices and tools leveraged to renegotiate lower transportation costs;
- T2G procurement benefits on schedule to deliver raw material savings in 2020 that exceed the cost benefits from lower indices, as well as savings in indirect spending; and
- Tighter management of working capital, which significantly contributed to the strong cash generation reported for 2019.
- A reduction of nearly 1,000 FTEs
Also, thanks to a more efficient allocation across projects, capital expenditure, including T2G-related investments, remained stable versus 2018.
To faster address changing demand trends and accelerate time-to-market of new products, both for retail customers and our local Ontex brands, we redesigned our innovation and industrialization processes, and have invested in an assembly line fully dedicated to baby care innovation and product development. With this, we will be launching innovations at a faster pace, effective as early as 2020.
Investing in local manufacturing capacity in the US to support further growth
Capitalizing on our solid commercial progress in the US since entering the market in 2016 and to support further growth, we have decided to invest in local manufacturing in the East of the country, initially to complement our shipments from abroad. The investment related to this meaningful strategic step for our US business will fit within our previously-announced capital expenditure plan, and is foreseen to start up in 2021.
Current assessment of possible impact of Coronavirus on Ontex business
As of today, we have not experienced any material adverse impact of the coronavirus on the company.
Ontex sales in China and other countries of the Far East are not material. We source several raw materials from a small base of suppliers in China and a few other Asian countries; at this moment, most of our key suppliers have given assurances that their activity is not affected by the coronavirus. However, we have started to build extra inventory for the most critical supplies, and are activating alternative sourcing wherever possible. Our business in Europe has not been affected so far. Further spread of the coronavirus leading to restrictions in the transportation of goods and individuals could nevertheless lead to disruptions to our supply chain and manufacturing organization, increased logistics costs and delayed shipments to customers. We continue to monitor the situation closely.
2020 Outlook
We expect to deliver higher revenue, operating profitability and net profit in 2020.
- Revenue: We forecast low single digit LFL revenue growth, driven by another year of solid top line growth in AMEAA; sales in Europe and Healthcare should be broadly stable versus 2019 with a slow start in Q1 and improving thereafter, as T2G-driven commercial plans to strengthen our market positions are gaining momentum.
- Adjusted EBITDA at constant currencies is expected to increase to €270/€275 million in 2020 from €245 million in 2019, on the back of a strong improvement in gross margin, thanks to increasing benefits from our T2G program and lower raw material indices.
- Capital expenditure: We anticipate capital expenditure of approximately 5% of revenue including T2G-specific capex.
As a result, we expect to further reduce our leverage by year-end 2020.
We will provide an update regarding progress against our 2021 targets at the time of our Q1 2020 trading update in May.
Operational Review: Categories
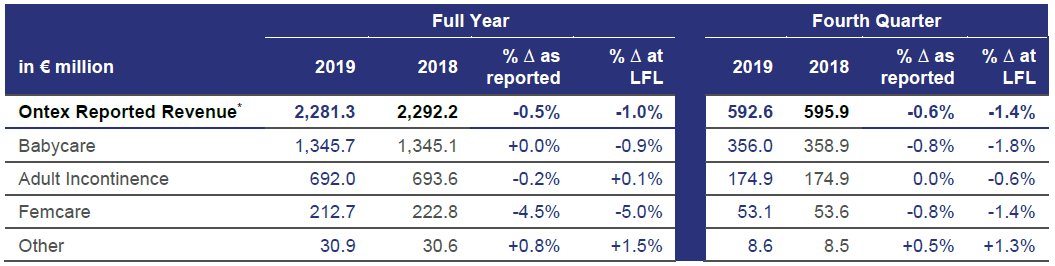
Revenue in the Babycare category decreased -0.9% in FY 2019, explained by lower volumes of retailer brands in Europe. However, both category sales and European retailer brand volumes improved in the second half of the year. Investments made over the past two years to raise Baby pants production capacity underpinned sales growth above category trends, reflecting the shift by consumers towards this product. In AMEAA, sales of Ontex branded baby diapers grew in 2019.
Adult Incontinence (Adult Inco) revenue was slightly up in FY 2019 versus a year ago (+0.1%). In retail channels, revenue was up +2% as the sales increase of Ontex brands in developing markets was partly offset by lower sales of retailer brands in Europe. Revenue in institutional channels posted a limited decrease following a strong 2018. Higher demand for Adult pants led to sales increases in both retail and institutional channels.
Feminine Care category (Femcare) revenue was down -5.0% in FY 2019 after a strong 2018, albeit with better trends in the second half of the year. Europe reported lower sales of retailer brands, which are today the largest part of category revenue, while Ontex own brands and sales to lifestyle customers posted growth in AMEAA. Demand for organic cotton tampons remained strong, and we are adding production capacity in order to support growth in this category.
Operational Review: Divisions
Europe
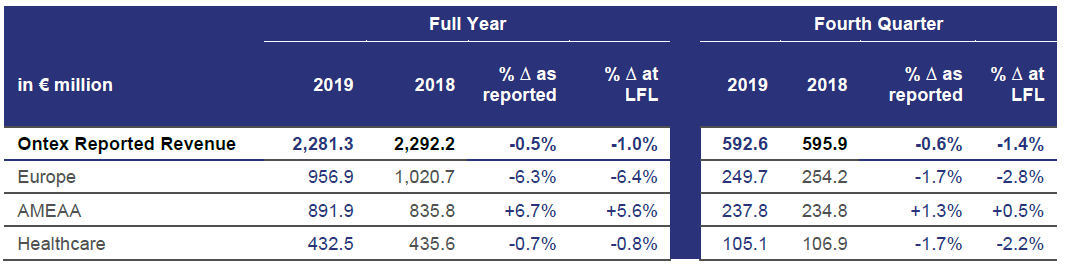
FY 2019 revenue in our Europe Division was 6.4% lower compared with FY 2018, impacted by lower volumes in the three product categories, as anticipated. The market environment remained highly competitive, marked by continued, intense promotional activities by the international branded leader in baby care. Higher sales of baby pants, as well as improved innovation management, commercial approach and support to leading retailers as part of T2G underpinned the improved sales trends in the second half of 2019. The growth of our baby diaper subscription offering (“Little Big Change”), launched in France in July 2018, accelerated across the year.
Americas, Middle East, Africa and Asia (AMEAA)
Our AMEAA Division posted a strong year with revenue growth of 5.6% in FY 2019, on the back of higher volumes and improved price/mix. Importantly, all categories and geographies delivered higher sales. Our unique approach of providing solutions for consumers with a portfolio of local brands in developing markets, and helping retailers or lifestyle customers in the US grow with their own brands continued to demonstrate its merits. In the competitive Mexican market, sales growth was led by good performances of our Baby Care brands bbtips and Chicolastic. Revenue developed positively throughout 2019 in Brazil, where sales of Baby Care brands Cremer and Pompom and Moviment in Adult Care rose. Sales were up in the US on the back of growing lifestyle and retailer brand volumes, and the Canbebe baby diaper and Canped Adult Care brands posted healthy topline growth in the MEAA region. Divisional sales in Q4 had a limited increase against a strong comparable base in Q4 2018, and healthy growth is expected to resume in 2020.
Healthcare
FY 2019 Healthcare Division revenue decreased -0.8% versus 2018. In highly competitive institutional channels, sales were lower on lower contract business, which will also impact the first months of 2020. This was largely offset by good growth in self-pay and e-commerce activities. Adult Pants continued to post revenue growth. Innovation remained central to our efforts to provide users with effective, discrete solutions to the full range of their needs: iD Intime, an absorbent underwear range for women, was voted 2020 Product of the Year in the incontinence products category in Belgium following its launch in May 2019. This is the third time in the past 4 years that innovative incontinence products from Ontex receive this recognition from Belgian consumers.
Operational Review: Geographies
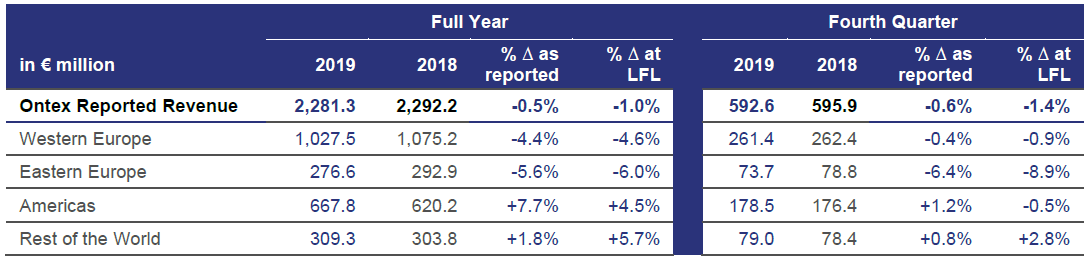
Revenue growth was driven by Americas, nearly compensating lower sales in Europe as expected. Our increased exposure to developing markets with Ontex brands continues to provide a growth platform alongside our important position as a partner to leading retailers in developing their brands.
FINANCIAL REVIEW
Selected P&L Financial Information
Gross profit
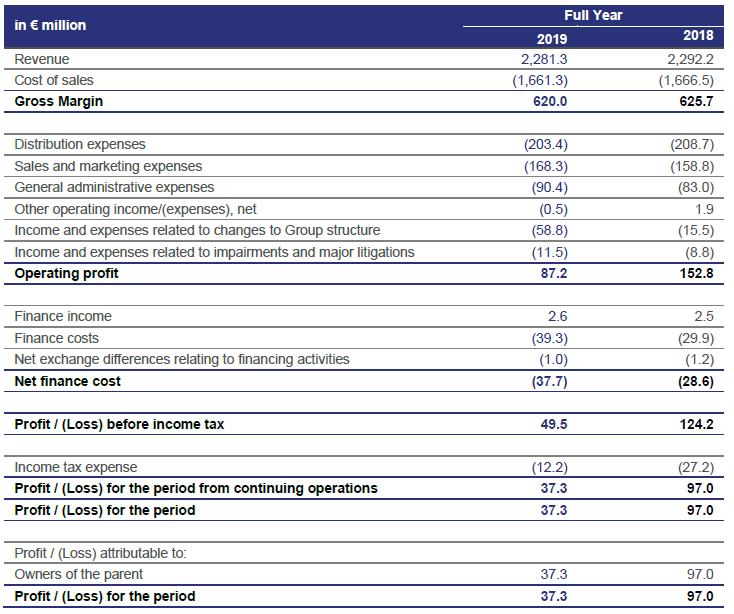
Gross profit amounted to €620.0 million in FY 2019, a limited decrease of 1.4% compared with the previous year. Gross profit growth in H2 2019 nearly offset the decrease recorded in the first half of the year. Gross profit as a percentage of sales was 27.2% in 2019, down 26 basis points versus prior year. 2019 gross profit benefitted from another year of savings and efficiencies, mostly as results of the T2G implementation, as well as a positive contribution from sales price/mix effects, nearly offset foreign exchange and raw material headwinds.
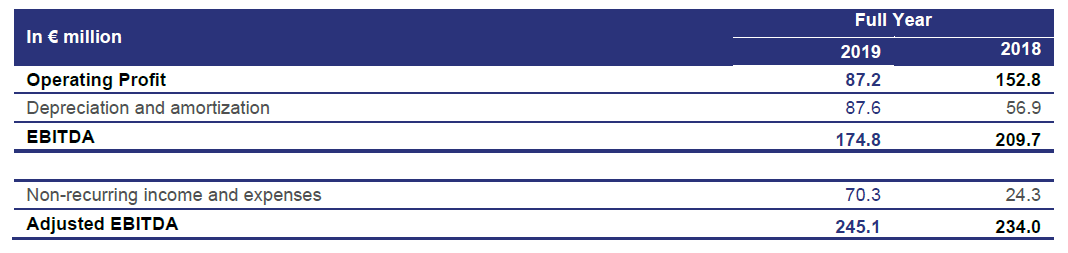
Adjusted EBITDA
2019 Adjusted EBITDA totaled €260.7 million at constant currencies, 1.1% below prior year and supported by improving trends in the second half of the year as anticipated. Adjusted EBITDA at constant currencies was broadly stable while we continued to invest to strengthen our engineering and commercial capabilities.
Non-recurring income and expenses
Non-recurring expenses amounted to €70.3 million in 2019, primarily due to restructuring expenses and consulting fees related to the implementation of the T2G program. The cash flow impact of non-recurring expenses was limited to €30.1 million in 2019 due to differences between expense recognition, which has been more front-loaded in 2019 linked to the start of many T2G initiatives, and cash out which will be more evenly spread over the T2G program period of 2019 to 2021.
In 2020 we expect non-recurring expenses recognized in the income statement at €35 million to €40 million, of which €25 million to €30 million related to the implementation of T2G. The forecast cash-outs related to non-recurring items ranges from €45 million to €50 million, of which €35 million to €40 million related to the T2G implementation.
Foreign Exchange
The rates of our functional currencies versus the euro remained volatile during 2019. Group revenue ended up benefiting from a positive effect of +€11.1 million, essentially due to a stronger Mexican Peso and US Dollar partly offset by weaker Turkish Lira, Brazilian Real and Pakistani Rupee, relative to the euro. However, the impact on Adjusted EBITDA of variations of currencies versus the euro was -€15.7 million, mainly attributable to the stronger US Dollar, the currency in which we purchase a large part of our raw materials, as well as the weaker Turkish Lira.
Net Finance Costs
2019 net finance costs were €37.7 million, 6.6% more than prior year, mainly linked to a higher average interest rate due to an increase in net debt in H1 2019. There was also an increase in the proportion of local debt within total debt, in order to better match finance payments with operating cash flows; such local debt carries a higher interest rate.
Income Tax Expense
The income tax expense was €12.2 million in 2019, for an effective tax rate of 24.7%.
Working Capital
At the end of 2019, working capital as a percentage of FY revenue was 9%*, marking a strong improvement on top of the 11.2%* achieved at the end of 2018. A coordinated, cross-functional approach implemented during 2019, including specific trade receivables, trade payables and inventory management practices implemented through the T2G program, account for this excellent performance.
Capital expenditure
Capital expenditure was €103.9 million in 2019, or 4.6% of revenue. This amount includes T2G-specific capex and was at the lower end of our initial range planned for the year.
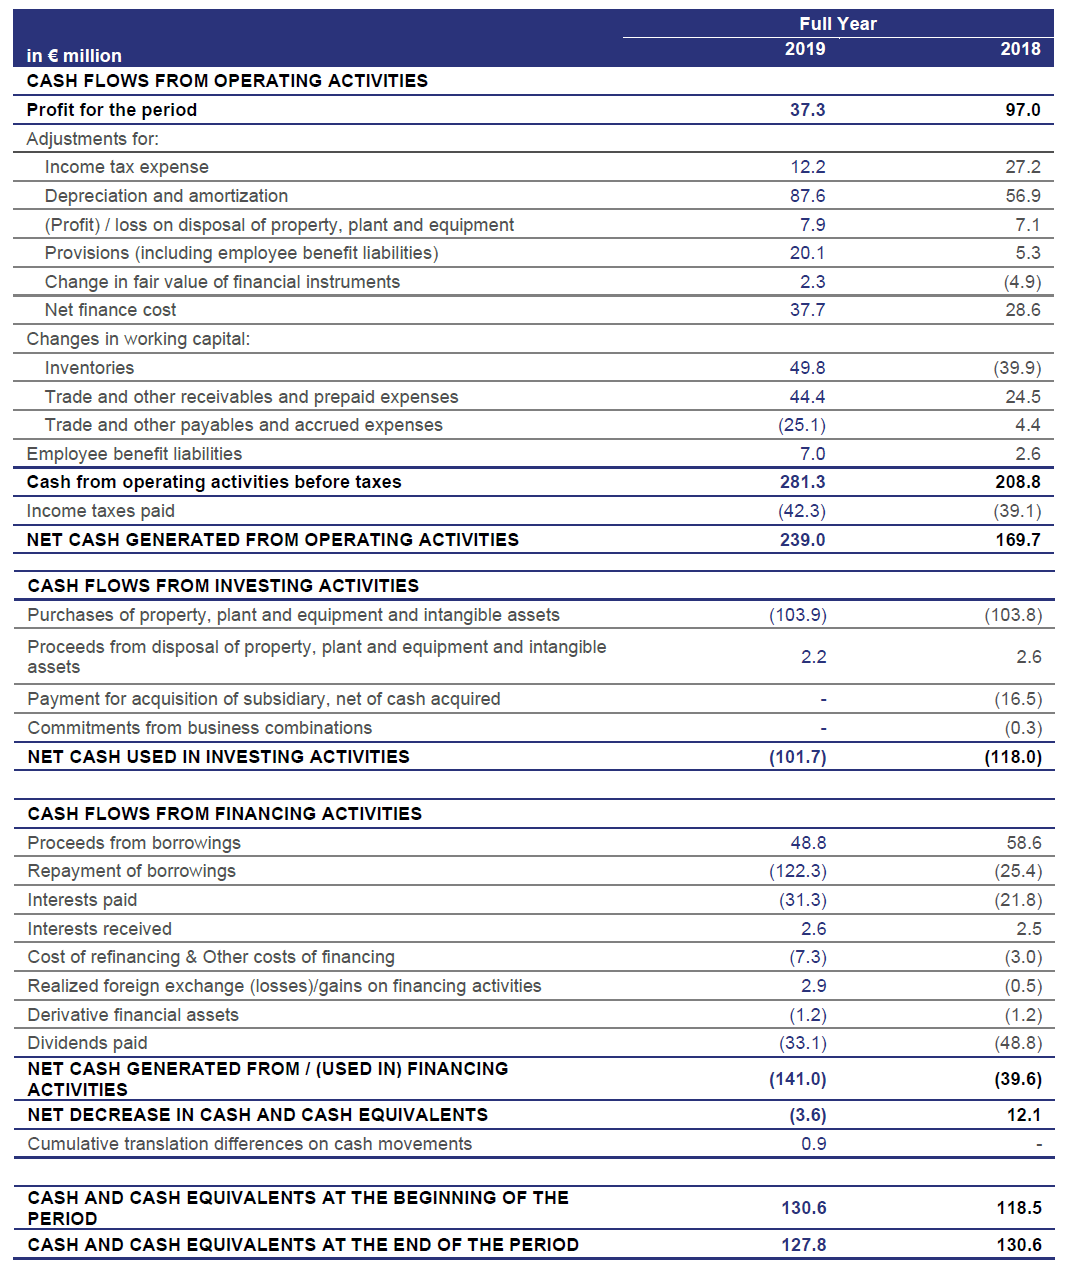
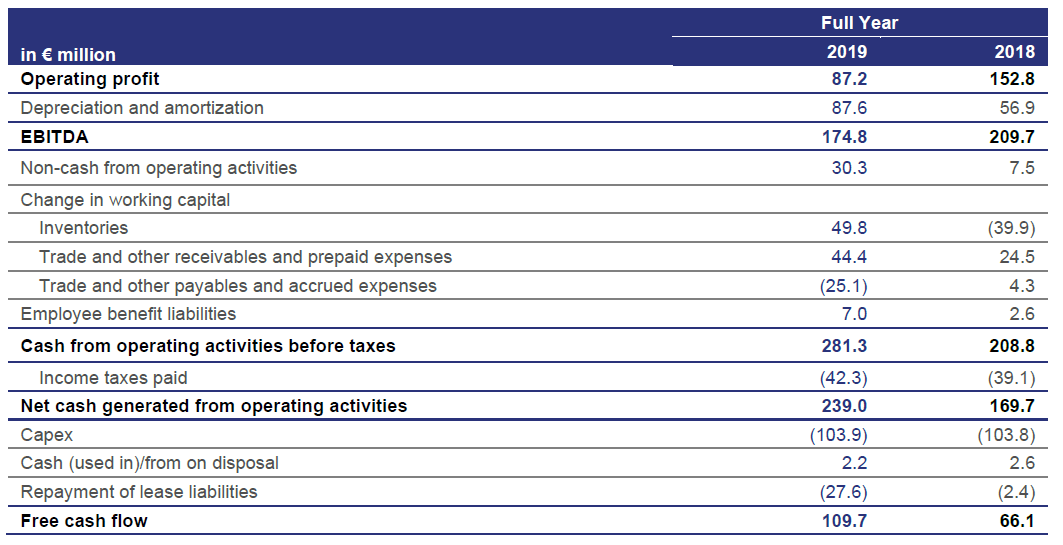
Free Cash Flow (post tax)
Free cash flow (post tax) improved by a very strong +50.5% or €36.8 million in 2019 to €109.7 million, net of €29.9 million in T2G-specific cash outflows (for one-off expenses and capital expenditure). Improved management of our working capital was the main driver for the strong cash generation.
* excluding trade receivables monetized through factoring lines: €161 million at 2019 end, €163 million at 2018 end
Corporate information
The above press release and related financial information of Ontex Group NV for the twelve months ended December 31, 2019 was authorized for issue in accordance with a resolution of the Board on March 3, 2020.
CONFERENCE CALL
Management will host a presentation for investors and analysts on March 4, 2020 at 9:00am CET/8:00am UK.
A copy of the presentation slides will be available at http://www.ontexglobal.com/
If you would like to participate in the conference call, please dial-in 5 to 10 minutes prior using the details below:
Belgium +32 (0)2 400 6926
France +33 (0)1 76 77 22 57
Germany +49 (0)69 2222 2018
United Kingdom +44 (0)330 336 9411
United States +1 323-994-2093
Passcode: 5366650
FINANCIAL CALENDAR 2020
Q1 2020 May 6, 2020
AGM May 25, 2020
H1 2020 July 30, 2020
Q3 2020 November 4, 2020
Notes to the Consolidated Financial Information
Note 1 Legal Status
Ontex Group NV is a limited-liability company incorporated as a “naamloze vennootschap“ (“NV”) under Belgian law with company registration number 0550.880.915. Ontex Group NV has its registered office at Korte Keppestraat 21, 9320 Erembodegem (Aalst), Belgium. The shares of Ontex Group NV are listed on the regulated market of Euronext Brussels.
Note 2 Accounting Policies
The accounting policies used to prepare the financial statements for the period from January 1, 2019 to December 31, 2019 are consistent with those applied in the audited consolidated financial statement for the year ended December 31, 2018 of Ontex Group NV, except for the introduction of the new requirements applied to lease agreements as a result of the application of IFRS 16 – Leases. The accounting policies have been consistently applied to all the periods presented.
The Group applied the new guidelines for lease accounting retrospectively with the cumulative effect of initially applying the standard recognized on January 1, 2019 (modified retrospective approach) in accordance with the transition requirements of IFRS 16. The comparative statements have not been restated.
The impact of the changes in accounting policies impacts only the opening balance of equity (reversal of operating lease incentives recognized previously as deferred income) and the opening balance of the statement of financial position. As a result of the application of the revised accounting policies due to the application of IFRS 16 on a modified retrospective basis, the Group recognized lease liabilities for an amount of € 148.0 million relating to leases previously classified as operating leases under IAS 17. These liabilities were measured at the present value of the remaining lease payments, discounted using the Group’s incremental borrowing rate as of January 1, 2019.
The related right-of-use assets were measured at the amount equal to the lease liability, adjusted for the outstanding balance of accrued rental expenses and an initial estimate of restoration and dismantling costs amounting to € 0.3 million and the outstanding balance of assets relating to favourable lease contracts acquired as part of past business combinations.
Leases classified under IAS 17 as finance leases were previously presented a part of property, plant and equipment (2018: € 6.5 million) and are, as from 2019, presented as part of the new line item “Right-of-use assets” in the statement of financial position. No contracts have been assessed to be onerous at transition date.
The weighted average incremental borrowing rate used at transition date is 4.56%.
Note 3 Events after the Reporting Period
No significant events occurred after the reporting period.
Note 4 Auditors Report
The statutory auditor has confirmed that the audit, which is substantially complete, has not to date revealed any material misstatement in the draft consolidated accounts, and that the accounting data reported in the press release is consistent, in all material respects, with the draft accounts from which it has been derived.
Note 5 Alternative Performance Measures
Alternative performance measures (non-GAAP) are used in this press release since management believes that they are widely used by certain investors, securities analysts and other interested parties as supplemental measure of performance and liquidity. The alternative performance measures may not be comparable to similarly titled measures of other companies and have limitations as analytical tools and should not be considered in isolation or as a substitute for analysis of our operating results, our performance or our liquidity under IFRS.
Like-for-like revenue (LFL)
Like-for-like revenue is defined as revenue at constant currency excluding change in scope of consolidation or M&A.
Non-recurring Income and expenses
Income and expenses classified under the heading “non-recurring income and expenses” are those items that are considered by management not to relate to transactions, projects and adjustments to the value of assets and liabilities taking place in the ordinary course of activities of the Company. Non-recurring income and expenses are presented separately, due to their size or nature, so as to allow users of the consolidated financial statements of the Company to get a better understanding of the normalized performance of the Company. Non-recurring income and expenses relate to:
- acquisition-related expenses;
- changes to the measurement of contingent considerations in the context of business combinations;
- changes to the Group structure, business restructuring costs, including costs related to the liquidation of subsidiaries and the closure, opening or relocations of factories;
- impairment of assets and major litigations.
Non-recurring income and expenses of the Group for the years ended December 31 are composed of the following items presented in the consolidated income statement:
- income/(expenses) related to changes to Group structure; and
- income/(expenses) related to impairments and major litigations.
EBITDA and Adjusted EBITDA and related margins
EBITDA is defined as earnings before net finance cost, income taxes, depreciations and amortizations. Adjusted EBITDA is defined as EBITDA plus non-recurring income and expenses. EBITDA and Adjusted EBITDA margins are EBITDA and Adjusted EBITDA divided by revenue.
Net financial debt/LTM Adjusted EBITDA ratio (Leverage)
Net financial debt is calculated by adding short-term and long-term debt and deducting cash and cash equivalents. LTM adjusted EBITDA is defined as EBITDA plus non-recurring income and expenses for the last twelve months (LTM).
Free Cash Flow
Free cash flow was previously defined as Adjusted EBITDA less capital expenditures (Capex, defined as purchases of property, plant and equipment and intangible assets), less change in working capital, less income taxes paid. This means that operating lease payments were included in the Free cash flow.
As a result of the application of IFRS 16, lease payments will be reported as cash flows from financing activities. Considering that operationally nothing has changed and IFRS 16 is only an accounting change, the definition of free cash flow is adjusted to include the repayment of lease liabilities (i.e. excluding the interest expense).
Furthermore, the Group decided to disclose from now on Free cash flow instead of Adjusted free cash flow in order to facilitate the reading and the reconciliation with the consolidated cash flow statement. As such, free cash flow is defined as net cash generated from operating activities (as presented in the consolidated cash flow statement, i.e. including income taxes paid) less capital expenditures (Capex, defined as purchases of property, plant and equipment and intangible assets), less repayment of lease liabilities and including cash (used in)/from disposal.
Adjusted Profit & Adjusted EPS (earnings per share)
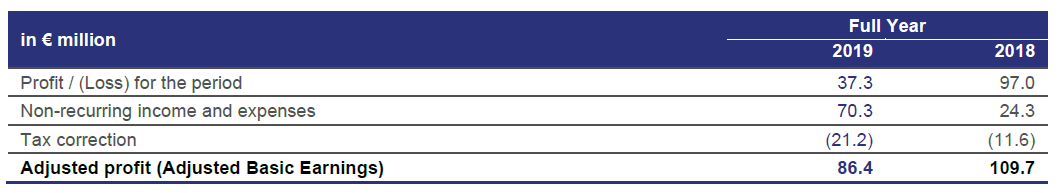
Adjusted Profit (or Adjusted Basic Earnings) is defined as profit for the period plus non-recurring income and expenses and tax effect on non-recurring income and expenses, attributable to the owners of the parent. Adjusted EPS is Adjusted Profit divided by the weighted average number of ordinary shares.
Working Capital
The components of our working capital are inventories plus trade receivables and prepaid expenses and other receivables plus trade payables and accrued expenses and other payables.
ANNEX A ONTEX GROUP NV CONSOLIDATED FINANCIAL INFORMATION
Consolidated Income Statement
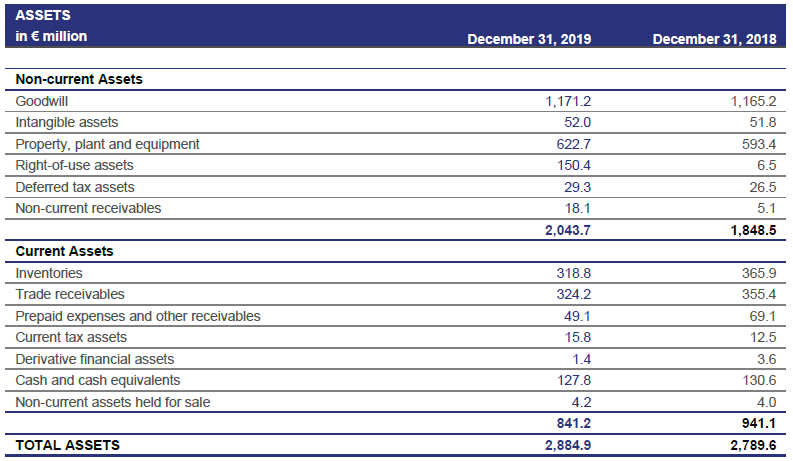
Consolidated Statement of Financial Position
Consolidated Statement of Cash Flows
Additional Financial Information
EARNINGS PER SHARE
Additional Financial Information
RECONCILIATION OF ALTERNATIVE PERFORMANCE MEASURES
EBITDA and Adjusted EBITDA
Adjusted profit (Adjusted basic earnings)
Free Cash Flow
Annex B
ANNEX B – PRO FORMA IMPACT OF IFRS 16 ON 2018 EBITDA AND NET DEBT
DISCLAIMER
This report may include forward-looking statements. Forward-looking statements are statements regarding or based upon our management’s current intentions, beliefs or expectations relating to, among other things, Ontex’s future results of operations, financial condition, liquidity, prospects, growth, strategies or developments in the industry in which we operate. By their nature, forward-looking statements are subject to risks, uncertainties and assumptions that could cause actual results or future events to differ materially from those expressed or implied thereby. These risks, uncertainties and assumptions could adversely affect the outcome and financial effects of the plans and events described herein.
Forward-looking statements contained in this report regarding trends or current activities should not be taken as a report that such trends or activities will continue in the future. We undertake no obligation to update or revise any forward-looking statements, whether as a result of new information, future events or otherwise. You should not place undue reliance on any such forward-looking statements, which speak only as of the date of this report.
The information contained in this report is subject to change without notice. No re-report or warranty, express or implied, is made as to the fairness, accuracy, reasonableness or completeness of the information contained herein and no reliance should be placed on it.
In most of the tables of this report, amounts are shown in € million for reasons of transparency. This may give rise to rounding differences in the tables presented in the trading update.
This trading update has been prepared in Dutch and translated into English. In the case of discrepancies between the two versions, the Dutch version will prevail.
Contact