Aalst-Erembodegem, March 5, 2015 – Ontex Group NV (Euronext Brussels: ONTEX; ‘Ontex,’ ‘the Group’ or ‘the Company’) today announced their unaudited results for the fourth quarter (Q4) and Full Year (FY) ending December 31, 2014.
FY 2014 Highlights
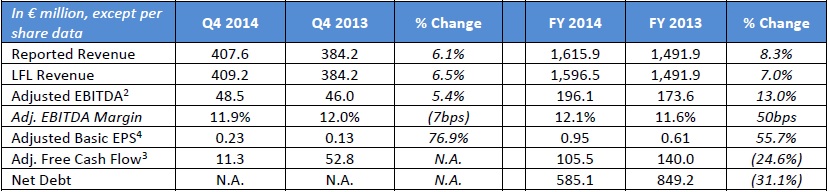
• Revenue at €1.6 billion, up 8.3% on a reported basis and 7.0% on a like-for-like (LFL)1 basis
• Solid growth of Adjusted EBITDA2 by 13.0% to €196.1 million despite an adverse FX impact of €9.8 million, resulting in an Adjusted EBITDA margin expansion of 50 basis points to 12.1%
• Adjusted Free Cash Flow3 below last year mainly due to rebuild of inventory in the first half of the year from low levels at the end of 2013, partly offset by higher EBITDA
• Net Debt was €585.1 million as of December 31, 2014, leading to a net financial debt/LTM Adjusted EBITDA ratio of 2.98x
• The Board of Directors has proposed a first dividend of €0.19 per share, subject to shareholder approval at the Annual General Meeting of Shareholders. This represents a payout ratio of 35% of net profit consistent with the company’s dividend policy as outlined during the IPO in June 2014. On an exceptional basis, the net profit is adjusted based upon the six month period in 2014 the company was listed, and also for one-time IPO and refinancing costs of €65.4 million.
Q4 2014 Highlights
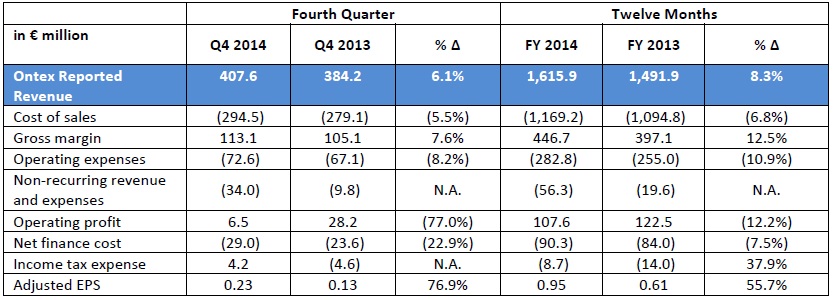
• Revenue of €407.6 million, up 6.1% on a reported basis; revenue up 6.5% on a LFL basis
• Adjusted EBITDA2 rose 5.4% year-on-year to €48.5 million despite €4.7 million of adverse FX impact, with a slight contraction versus Q4 2013 of 7 basis points in Adjusted EBITDA margin to 11.9%
Key Financials Q4 2014 and FY 2014
CEO Charles Bouaziz: “2014 was an outstanding year for Ontex. We grew revenue like-for-like at 7%, above the top end of our medium-term model. Q4 LFL growth of 6.5% featured a strong performance in developing markets, while developed markets also advanced in a very challenging environment. All Divisions and categories contributed positively for both the quarter and year, demonstrating the strength of Ontex’s balanced portfolio: growing competitive retailer brands in developed markets, and offering our own brands for institutional channels and retail in developing markets. And we delivered profitable growth, with Adjusted EBITDA margin improving by 50 basis points while maintaining a disciplined commercial approach and continuing to invest in the business.
2014 was also a significant year as we completely transformed our financial structure through a successful IPO and a subsequent refinancing. The IPO in June was a milestone for Ontex, which not only helped to reduce our debt, but significantly improved our profile towards customers, suppliers and employees. In November 2014 we saw an opportunity to bring forward our refinancing plans to take advantage of the low cost of debt. Our interest charge will decrease by approximately €29 million in 2015. This stronger financial position is reflected in our rating with the credit agencies.
2014 was also the year we transformed the company from an R&D and manufacturing company operating in the consumer goods business, into a more consumer-focused company. We have worked hard to put the consumer at the center of our organization and increased efforts to work with our customers. In a tough competitive environment, customers want our insight and understanding of consumer needs across product categories. We deliver products that meet consumer needs – combining performance and affordability, and anticipate new trends, fueling our future growth.
To sum up, 2014 confirmed our model to outperform the attractive categories we serve, which are driven by a combination of growing retailer brand market share, favorable demographic trends and increasing product adoption rates.”
1 LFL is defined as at constant currency excluding change in perimeter of consolidation or M&A
2 Adjusted EBITDA is a non-IFRS measure, defined as EBITDA plus non-recurring expenses (including the 2014 IPO and refinancing) and revenues excluding non-recurring depreciation and amortization and has consistently been applied throughout reporting periods. EBITDA is a non-IFRS measure, defined as earnings before net finance cost, income taxes, depreciation and amortization. For further detail refer to Annex A, page 16.
3 Adjusted Free Cash Flow calculated as Adjusted EBITDA less capex, change in working capital and cash taxes paid. Adjusted FCF calculation changed from prior year quarterly disclosure to align with cash flow statement. For reconciliation with previous reporting, refer Annex A, page 17.
4 Adjusted Basic Earnings per share (Adjusted Basic EPS) excludes non-recurring expenses of €56.3 million for FY 2014; €34.0 million for Q4 2014. For definition and further detail refer to Annex A, page 15.
Market Dynamics
We estimate that our markets grew around 4% for the year, but with some evidence of a slowdown toward the end of the year due to competitive pressures from Retailers and Health Systems. The retail environment remained highly competitive throughout the year, placing further emphasis on the need to differentiate through innovation and quality, with retailers confirming the importance of providing “best value” solutions in the hygienic disposable categories. Retailer brands gained additional volume and value share of hygienic disposables in Western Europe. Growth was further stimulated by the exit during 2013 of Kimberly Clark (KC) from the Western European baby diaper market, which had an important impact during 2013 until mid 2014. Developing markets had strong growth, while institutional markets were stable with pressure due to government budget cuts.
Significant currency fluctuations in 2014, in particular for the Turkish Lira, Russian Rouble and Australian Dollar over the year, had an overall negative impact on revenue and Adjusted EBITDA, while movements in the British Pound were favourable.
Raw material pricing increased for the major commodity groups in 2014, as well as in Q4; strengthening of the US Dollar versus the euro, especially in the second half of the year, further increased fluff costs for Ontex. The sharp decline in oil prices in H2, and particularly Q4, did not lead to lower oil-based raw material prices in 2014 due to the time lag in our price mechanism.
Overview of Ontex Performance in 2014
Ontex delivered a strong set of results for 2014, with revenue growing 7.0% LFL to €1.6 billion, and Adjusted EBITDA margin expanding by 50 basis points to 12.1%. Higher revenue was due in part to underlying positive market growth of around 4% based on management estimates, albeit with some signs of slower growth toward the end of the year. We also outgrew the market, based upon market share gains with our own brands and with retailer brands.
Adjusted EBITDA rose 13.0% to €196.1 million as a result of solid top line growth, the incremental contribution from Serenity in Q1 2014, and an ongoing focus on improving efficiency.
Operational Review: Divisions
Mature Market Retail
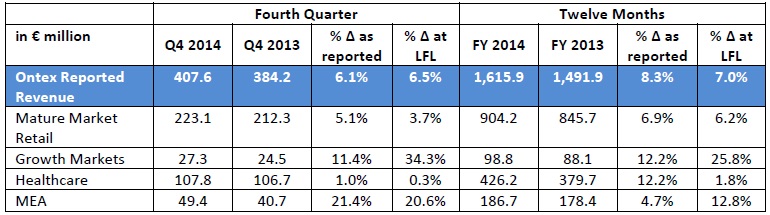
Revenue in the Mature Market Retail Division rose 3.7% in Q4 2014 on a LFL basis, and grew 6.2% on a LFL basis for FY 2014; both periods had strong comparable results in the prior year. Fourth quarter and FY 2014 sales in the majority of our top markets increased or were in line with the strong results of last year. In particular, solid growth was recorded for Q4 in the Benelux region, Southern Europe, Poland and Australia, while the UK and France were slightly below the prior year. For FY 2014, gains were seen in key markets such as the UK, Poland, Spain and Australia.
This growth is partly driven by the continuing increase of retailer brand share in our three personal hygiene categories seen over the past few years, and we increased our share of this segment, including capturing significant volumes following the exit of KC from the baby diaper market in Western Europe. 2014 demonstrated one of the underlying strengths of our model, which is supplying the high-quality, high-performance products retailers are looking for to build their brands.
Growth Markets
The Growth Markets Division delivered strong Q4 growth of 34.3% on a LFL basis, resulting in a FY LFL increase of 25.8%. Reported revenue was negatively impacted by changes in exchange rates. Our strong fourth quarter performance in Russia was a continuation of the momentum seen in previous quarters, and also partly benefited from the rapidly changing pricing environment. In light of the sharp currency decline, industry wide price adjustments pushed prices higher in Q4, and consumer purchases also accelerated in anticipation of further price hikes. In spite of near term volatility, we see further growth opportunities for Ontex in Russia by building brands with retailer partners, based on high quality products and customer service. Next to Russia, we grew in countries of Central and Eastern Europe where the mix of modern and traditional retail fits well with our strengths.
Healthcare
On a LFL basis, Healthcare revenue moved 0.3% higher in Q4 and up 1.8% for the year, slightly ahead of estimated market growth for institutional channels we supply. Reported revenue was higher due to the first quarter contribution of Serenity. Fourth quarter revenue grew in Italy, Spain and Benelux, which more than offset lower revenue in Germany primarily due to the scaling back of some contracts as disclosed in Q3, and in the UK.
MEA
Q4 2014 revenue was up 20.6% LFL in the MEA Division, with FY 2014 growth ending up 12.8% on a LFL basis. Reported revenue was also negatively impacted by changes in exchange rates. These LFL revenue increases were largely driven by solid performances of our brands in Turkey, Morocco and Pakistan, where our market shares and revenue evolved favorably. We continued commercial investments to ensure brand health and enhance sales execution, in order to remain competitive against international and local brands.
Operational Review: Categories
Babycare
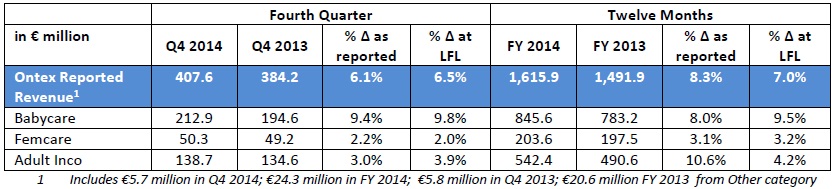
Babycare category revenue rose 9.8% LFL during Q4 2014, and delivered full year LFL growth of 9.5%. Sales increased due to the continuing positive environment for retailer brands in developed markets, as shown by retailer brand share of Babycare in Western Europe increasing 1 percentage point to 32.5%, as well as through our own brands in markets where retail is more fragmented.
Femcare
The Femcare category posted higher revenue 2.0% in Q4 on a LFL basis, leading to a FY 2014 LFL increase of 3.2%, in line with market growth in the geographies we are present in. Growth was mainly achieved based on share increases with retailer brands in developed markets.
Adult Inco
Revenue for Adult Inco was up 3.9% during the fourth quarter of 2014 and 4.2% for FY 2014, on a LFL basis. In addition to higher revenue in the institutional channel, in our retail Divisions LFL sales were up 13% and 11% respectively for the quarter and full year, as we leverage our expertise and partner with retailers for their own brands.
Operational Review: Geographies
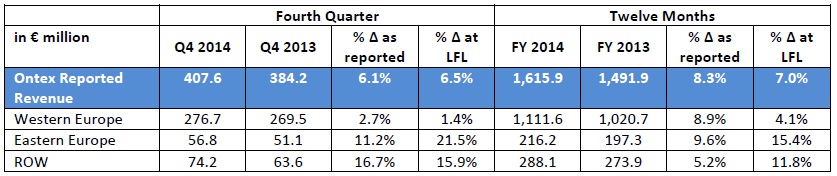
Combined revenue for Eastern Europe and ROW amounted to 32% of total Ontex revenue in Q4.
OUTLOOK
We enter 2015 with good momentum in our business and confidence in our medium-term growth model for outperformance in attractive markets. With the competitive environment in Retail and Health Systems impacting prices in some markets in the second half of 2014, we currently anticipate that our Ontex markets in 2015 will grow towards the middle to lower end of the 3-4% range. On top, we continue to target an outperformance of 1-2%, leading to 4-6% LFL growth while delivering sustainable improvement in margins.
We seek moderate Adjusted EBITDA margin expansion of around 30 bps a year, and we will continue to rely on our own actions, including efficiency gains. Fluff costs remain at an all-time high at the beginning of 2015, above the first half of 2014, and are also strongly influenced by the US Dollar/Euro exchange rate. We will only start seeing the impact of lower oil prices on the costs of our oil-based raw materials towards the end of Q1 2015, due to the time lag in our price mechanism.
FINANCIAL REVIEW
Selected P&L Financial Information
Selected Liquidity Financial Information
Gross Margin
Gross margin amounted to €446.7 million for 2014, a 12.5% increase compared to 2013, while Q4 2014 gross margin of €113.1 million was 7.6% higher year on year. As a percentage of sales, 2014 gross margin expanded to 27.6%, 102 basis points over last year, while Q4 2014 gross margin as a percentage of sales of 27.7% was 39 basis points above a year ago. The gross margin improvements can be partly attributed to increased operating leverage due to top line growth, an incremental contribution in Q1 from the Serenity acquisition as well as efficiency programs; however Q4 was more adversely impacted by changes in foreign exchange rates.
Adjusted EBITDA
Adjusted EBITDA is a non-IFRS measure is defined as EBITDA plus non-recurring expenses (including the 2014 IPO and refinancing) and revenues excluding non-recurring depreciation and amortization. EBITDA is also a non-IFRS measure, defined as earnings before net finance cost, income taxes, depreciation and amortization.
2014 Adjusted EBITDA rose by 13.0% to €196.1 million, and by 5.4% to €48.5 million in Q4. Growth for the full year was due to higher gross margins, while our main operating expenses increased broadly in line with revenue, reflecting the further strengthening of our organization as well as stronger geographical focus and increased functional support. Adjusted EBITDA for the fourth quarter increased at a lower rate than the full year, partly explained by lower gross margin expansion mentioned above, in which there was a negative foreign exchange impact, as well as a rise in sales and marketing expenses, leading to a slight contraction of Q4 Adjusted EBITDA margin.
Foreign Exchange
The impact of changes in foreign exchange rates on revenue for 2014 was negative, primarily in the first half of the year. This was mainly due to the negative evolution of the Turkish Lira, Russian Rouble and Australian Dollar versus the Euro, which was only partly compensated by a strengthening British Pound. In the fourth quarter, the foreign exchange impact on revenue was limited, as a lower Russian Rouble was largely offset by a strong British Pound.
Changes in foreign exchange rates impacted Adjusted EBITDA negatively in 2014, due to the above mentioned currency fluctuations. The Q4 impact on Adjusted EBITDA was on top negatively impacted by the stronger US Dollar, while the impacts of the lower Russian Rouble and strong British pound largely offset each other.
Net Finance Costs
The net finance cost for 2014 totalled €90.3 million, 7.5% higher than the previous year. Interest expenses on the group’s debt decreased in 2014 by 12% or nearly €8 million due to a lower average level of debt since redemption of the €280 million Floating Rate Notes in July. However, these savings were more than offset by €11.6 million accelerated amortization of borrowing expenses related to the early redemptions of notes in July and December. In 2015, we will fully benefit from this refinancing which brings €29 million of annual interest costs savings on the remaining debt.
Income Tax Expense
Income Tax Expense was €8.7 million in 2014, a decrease of 38% compared to previous year.
Working Capital
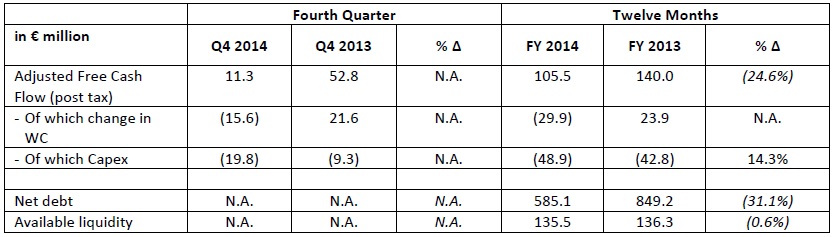
2014 working capital was at 11.4% of revenue compared to 10.9% in 2013. The increase is mainly due to a temporary buildup of VAT receivables in Italy, which is expected to unwind in 2016, as well as rebuilding baby diaper inventories in the first half of 2014 from low levels at the end of 2013 as previously disclosed. Q4 working capital needs increased by €15.6 million, partly explained by a negative impact from supplier payment cycle timing, as mentioned last quarter, whereby some supplier payments shifted into Q4.
Capex
Capital expenditures for 2014 were €48.9 million, representing 3% of sales and in line with our model.
Adjusted Free Cash Flow (post tax)
Adjusted Free Cash Flow calculated as Adjusted EBITDA (see definition above) less capex, change in working capital and cash taxes paid.
For 2014 adjusted free cash flow was €105.5 million, a decrease of 24.6% compared to 2013 primarily due to the increase of working capital detailed above, partly compensated by higher Adjusted EBITDA.
Financing and Liquidity
Cash and cash equivalents were €35.5 million at December 31, 2014.
Net debt at December 31, 2014 amounted to €585.1 million, and net leverage based on the last twelve months Adjusted EBITDA was 2.98x.
The revolving credit facility of €100 million was undrawn at the end of December 2014, and available liquidity was €135.5 million.
Dividends
The Board of Directors has proposed a first dividend of €0.19 per share, representing a payout ratio of 35% and consistent with the company’s dividend policy as outlined during the IPO in June 2014. The proposed dividend has been prorated to reflect the six month period of the 2014 financial year for which the shares were listed. In addition, given the exceptional nature of the IPO and subsequent refinancing costs, the Board has proposed, as a one-time exception, to exclude the non-recurring and finance expenses related to these two events for the purpose of the dividend calculation. The dividend is subject to shareholder approval at the Annual General Meeting of Shareholders.
Notes to the Unaudited Consolidated Financial Information
Note 1 Corporate Information
The above press release and related financial information of Ontex Group NV for the twelve months ended December 31 2014 was authorized for issue in accordance with a resolution of the Board on March 4, 2015.
Note 2 Legal Status
Ontex Group NV is a limited-liability company incorporated in the form of a naamloze vennootschap under Belgian law. Ontex Group NV has its registered office at Korte Keppestraat 21/31, 9320 Erembodegem (Aalst), Belgium. The shares of Ontex Group NV are listed on the regulated market of Euronext Brussels.
Note 3 Accounting Policies
The accounting policies used to prepare the financial statements for the period from January 1, 2014 to December 31, 2014 are consistent with those applied in the audited consolidated financial statement for the year ended December 31, 2013 of Ontex I Sà.r.l..
The accounting policies have been consistently applied to all the periods presented.
Note 4 Events after the Reporting Period
There are no events after the end of the reporting period.
Note 5 Auditors Report
The statutory auditor has confirmed that the audit, which is substantially complete, has not to date revealed any material misstatement in the draft consolidated accounts, and that the accounting data reported in the press release is consistent, in all material respects, with the draft accounts from which it has been derived.
Note 6 Information on 2014 and 2015 Divisional Structure
Following a review of the Group’s customers and countries, a slight modification to the 4 Divisions has been made for which revenue is reported, effective January 1 2015. A limited amount of activities which represent in aggregate less than 2% of Group revenue have been re-assigned to the Growth Markets Division from Mature Market Retail, Middle East Africa (MEA) which becomes Middle East North Africa (MENA), and Healthcare. Quarterly revenue data for 2013 and 2014, as well as reported and LFL changes for 2014 compared to 2013, are included in Annex B, as a basis for comparison in future reporting.
CONFERENCE CALL
Management will host a presentation for investors and analysts on March 5, 2015 at 8:00am GMT / 9:00am CET. A copy of the presentation slides will be available at http://www.ontexglobal.com/.
If you would like to participate in the conference call, please dial-in 5 to10 minutes prior using the details below:
United Kingdom: +44 20 3427 1905
United States: +1 718 971 5738
Belgium: +32 2 402 3092
Passcode: 6629963
FINANCIAL CALENDAR 2015
First Quarter 2015 May 11, 2015
Annual General Meeting May 26, 2015
Second Quarter and Half Year 2015 July 29, 2015
Third Quarter and Nine Months 2015 November 5, 2015
ENQUIRIES
Investors
Philip Ludwig
+32 53 333 730
[email protected]
Fairvue Partners
+44 20 7614 2900
[email protected]
Press
Gaëlle Vilatte
+32 53 333 708
[email protected]
Luc Osselaer
+32 476 451 501
[email protected]
Please read the full press release in the documents attached.
Contact