
- LFL revenue increased in developing markets, decreased in developed markets
- Adjusted EBITDA supported by cost savings and price/mix actions
- Launch of Transform to Grow (T2G) plan to step-change operational efficiency and drive commercial excellence
Aalst-Erembodegem, May 8, 2019 – Ontex Group NV (Euronext Brussels: ONTEX; ‘Ontex,’ ‘the Group’ or ‘the Company’) today announced its results for the three months ending March 31, 2019.
Financial highlights
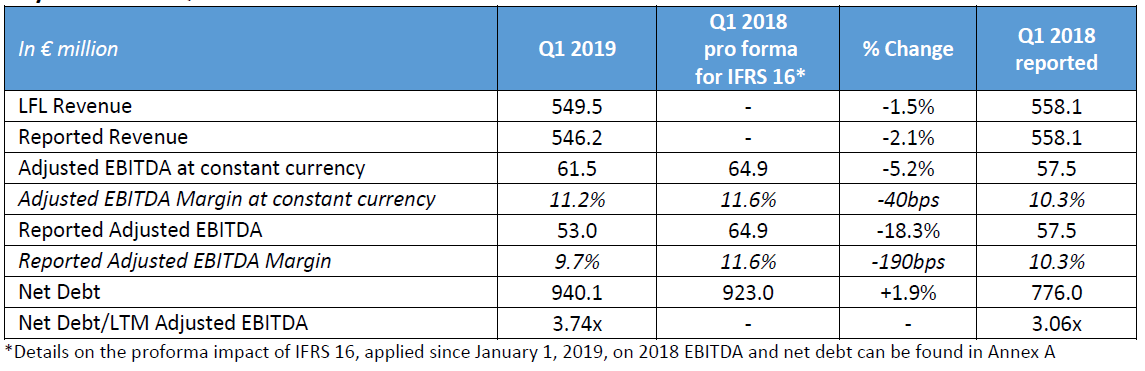
- Like-for-like (LFL) revenue of €549.5 million, down 1.5%, in line with our expectations
- Positive pricing and mix in all categories and Divisions
- Reported revenue was €546.2 million, down 2.1%
- Adjusted EBITDA of €61.5 million at constant currency
- Adjusted EBITDA margin at constant currency of 11.2%, down 40bps versus 2018 pro forma for IFRS 16
- Reported Adjusted EBITDA of €53.0 million, Adjusted EBITDA margin of 9.7%
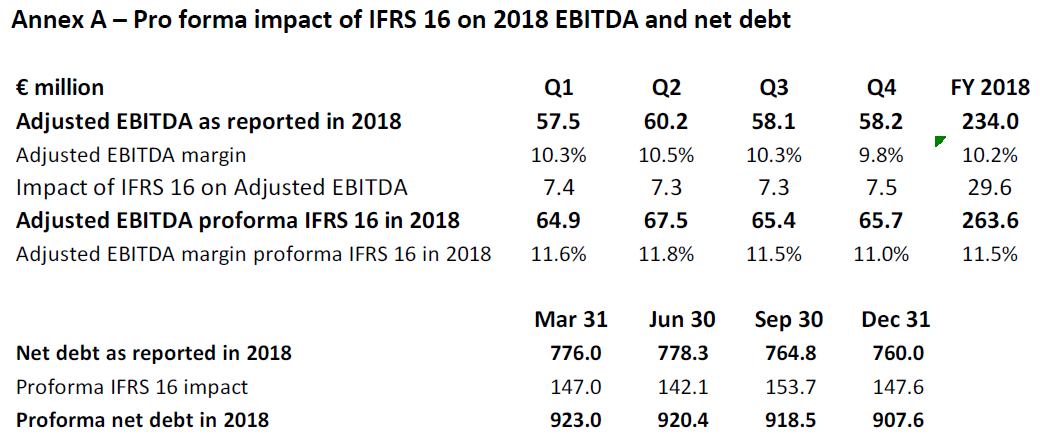
- Net debt stood at €940.1 million, up €17.1 million; net debt/LTM adjusted EBITDA was 3.74x
Operational highlights
- Top line: Increased sales of own brands, continued growth of Adult Inco
- Drive for profitability: Improved pricing and mix, significant capture of savings
- Launch of T2G: Transformation program to boost operating efficiency and drive commercial excellence
Key Financials Q1 2019
Management comment
Charles Bouaziz, Ontex CEO, commented: “Our first quarter performance was in line with the trends we signaled in March when we published our full-year results. Our revenue was impacted by lower sales of retailer brands in Europe, but we posted good growth of Ontex brands in other markets. While raw material costs have been stabilizing over the last months, year-on-year they remained a headwind in Q1, as did foreign exchange. However, we were able to partly mitigate them through cost savings and pricing actions. The T2G program that we are unveiling today at our Investor Update in London will boost operational efficiency and drive commercial excellence, taking Ontex to the next level by accelerating the execution of our strategic priorities and value creation.”
Launch of T2G to boost operational efficiency and drive commercial excellence
Ontex is launching its Transform2Grow plan, which will be presented during our Investor Update, taking place today (see page 5 for details). The T2G plan has two main objectives:
• Boost operational efficiency by reinvigorating our manufacturing strengths, optimizing transportation and warehousing, leveraging scale in procurement and enhancing innovation strengths in product design
• Drive commercial excellence by increasing focus on high-growth product segments, offering a more differentiated value proposition to customers and adapting our innovation process to increase speed to market.
Further details can be found in a separate press release published today on www.ontexglobal.com
2019 Outlook
We anticipate continued, but stabilizing, raw material and FX headwinds. Pricing, mix improvement and cost savings actions should attain their full effect in the second half of the year.
In this context, Ontex expects:
– Broadly stable sales at constant FX, with top-line growth in developing markets and lower revenue in developed markets;
– Stable Adjusted EBITDA at constant FX;
– Capex of 4.5% to 5.0% of revenue excluding T2G-specific Capex.
Market Dynamics
Trends in the personal hygiene markets where Ontex is present were similar at the start of 2019 to those of the second half of 2018. We saw some price improvements in Babycare outside of Europe, Adultcare category growth remained solid and was primarily volume-driven, while Femcare was broadly stable. Retailer brands continued to enjoy a strong performance in Babycare, with higher shares in Europe and North America.
Most commodity raw material market indices were at a higher level in Q1 2019 than the comparable period a year ago, reflecting the increases seen across 2018.
The majority of currencies in which we do business were weaker versus the euro in Q1 2019 compared with the same period in 2018. The exception was the US Dollar, which appreciated compared with the euro, weighing on the cost of our raw materials.
Operational Review: Categories
Babycare
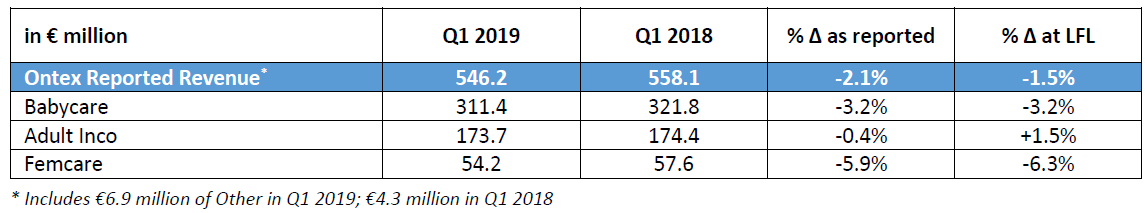
Q1 2019 Babycare revenue decreased by 3.2%. Sales of Baby pants continued to outperform Baby diapers, and we remain committed to serving growing consumer and customer demand for pants as an attractive alternative to diapers. Our local baby diaper brands posted higher revenue in the majority of our markets. The decrease in babycare was driven by contract losses of retailer brands in Europe in H2 2018.
Adult Inco
Revenue in the Adult Inco category was up 1.5% in Q1 2019 versus a strong comparable figure a year ago. Sales in retail channels, comprising our own brands as well as leading retailer brands, increased 8%. In institutional channels, revenue decreased against a high comparable figure last year. Demand for Adult pants was solid across retail and institutional channels.
Femcare
Femcare revenue was 6.3% lower in Q1 2019. Aside from the strong comparable a year ago, this is mainly explained by lower volumes related to contract losses of retailer brands in Europe, where the majority of our revenue is generated.
Operational Review: Divisions
Europe
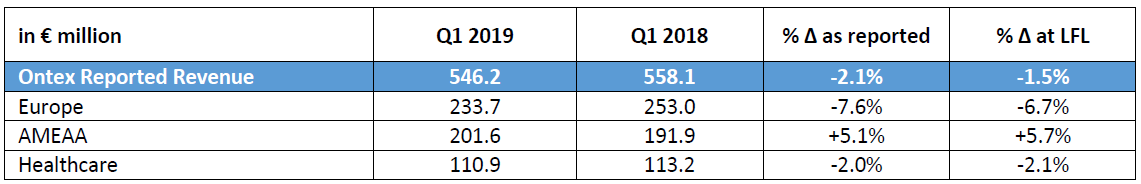
Revenue in our Europe Division was 6.7% lower in Q1 2019 compared with the same period a year ago. This expected decrease was due to lower volumes on the back of retailer brand contract losses, as mentioned in the FY 2018 results. The benchmark of our performance across key customer criteria carried out in the framework of T2G preparation confirmed many opportunities to return to growth through a number of focused commercial initiatives. This will take time to have a visible impact given the dynamics of retailer brand supply.
Americas, Middle East, Africa and Asia (AMEAA)
AMEAA Division posted solid revenue increase of 5.7% in Q1 2019 versus the same period last year. Revenue growth was broad-based across the majority of markets and all categories. Higher revenue was recorded in the Americas, including in Brazil and the USA, while Mexico was slightly down versus a strong performance in the same period last year. We also saw further growth in the Middle East and Africa. Sales in Asia decreased versus a very high comparable figure the previous year. We continued to focus on addressing specific consumer needs in each geography with our portfolio of local brands and improving our commercial execution, which will also benefit from T2G initiatives.
Healthcare
Q1 2019 Healthcare Division revenue was down 2.1% versus an exceptionally strong first quarter in 2018. An ongoing disciplined approach resulted in positive price/mix which was not sufficient to offset the negative volume impact. Sales of adult pants rose in most markets and were up at Division level.
Operational Review: Geographies
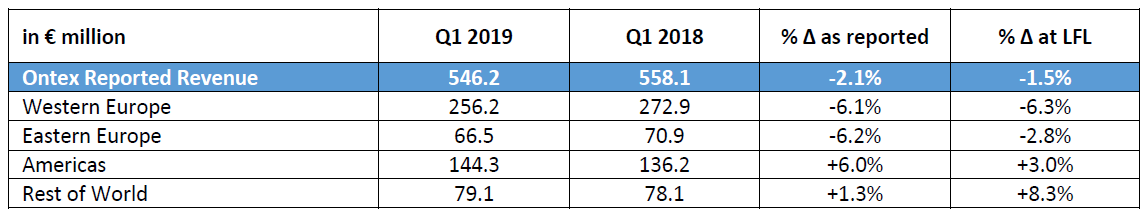
Americas and Rest of World posted higher sales, and represented more than 40% of Group revenue.
Adjusted EBITDA
Adjusted EBITDA at constant currency was €61.5 million in Q1 2019, a decrease of 5.2% compared with Q1 2018 pro forma for IFRS 16. Adjusted EBITDA margin at constant currency stood at 11.2%, -40bps versus Q1 2018 on the same basis. On a reported basis, Ontex posted an Adjusted EBITDA of €53.0 million and an Adjusted EBITDA margin of 9.7%.
The resilience of our Adjusted EBITDA margin at constant currency reflects our ongoing efforts to mitigate headwinds through optimized price/mix and cost savings.
Corporate information
The above press release and related financial information of Ontex Group NV for the three months ended March 31, 2019 was authorized for issue in accordance with a resolution of the Board on May 7, 2019.
Q1 2019 WEBCAST AND CONFERENCE CALL
A webcast and conference call for investors and analysts will be held on May 8, 2019 at 7:30am GMT/8:30am CET. A copy of the presentation slides will be available at http://www.ontexglobal.com/
Investors and analysts are invited to join via webcast using the following link:
https://channel.royalcast.com/ontexgroup/#!/ontexgroup/20190508_2
In addition, a limited number of conference call lines will be available. Please dial in 5-10 minutes before the scheduled start time to register your attendance. Dial-in numbers for the call are as follows:
Belgium +32 2 4035816
France +33 1 7272 7403
Germany +49 69 2222 25429
Netherlands +31 20 709 5119
United Kingdom +44 207 194 3759
United States +1 646 722 4916
PIN: 44239235#
INVESTOR UPDATE WEBCAST
Management will host an Investor Update for investors and analysts in London on May 8, 2019 at 10:30am GMT/11:30am CET.
The Investor Update will also be webcast and can be accessed through the following link:
https://channel.royalcast.com/webcast/ontexgroup/20190508_3/
FINANCIAL CALENDAR 2019
AGM May 24, 2019
H1 2019 July 31, 2019
Q3 2019 November 6, 2019
Contact
Alternative Performance Measures
Alternative performance measures (non-GAAP) are used in this press release since management believes that they are widely used by certain investors, securities analysts and other interested parties as supplemental measure of performance and liquidity. The alternative performance measures may not be comparable to similarly titled measures of other companies and have limitations as analytical tools and should not be considered in isolation or as a substitute for analysis of our operating results, our performance or our liquidity under IFRS.
Like-for-like revenue (LFL)
Like-for-like revenue is defined as revenue at constant currency excluding change in scope of consolidation or M&A.
Non-recurring Income and expenses
Income and expenses classified under the heading “non-recurring income and expenses” are those items that are considered by management not to relate to transactions, projects and adjustments to the value of assets and liabilities taking place in the ordinary course of activities of the Company. Non-recurring income and expenses are presented separately, due to their size or nature, so as to allow users of the consolidated financial statements of the company to get a better understanding of the normalized performance of the company. Non-recurring income and expenses relate to:
• acquisition-related expenses;
• changes to the measurement of contingent considerations in the context of business combinations;
• changes to the Group structure, business restructuring costs, including costs related to the liquidation of subsidiaries and the closure, opening or relocations of factories;
• impairment of assets and major litigations.
EBITDA and Adjusted EBITDA and related margins
EBITDA is defined as earnings before net finance cost, income taxes, depreciations and amortizations. Adjusted EBITDA is defined as EBITDA excluding non-recurring income and expenses. EBITDA and Adjusted EBITDA margins are EBITDA and Adjusted EBITDA divided by revenue.
Net financial debt/LTM Adjusted EBITDA ratio (Leverage)
Net financial debt is calculated by adding short-term and long-term debt and deducting cash and cash equivalents. LTM adjusted EBITDA is defined as EBITDA excluding non-recurring income and expenses for the last twelve months (LTM).
DISCLAIMER
This report may include forward-looking statements. Forward-looking statements are statements regarding or based upon our management’s current intentions, beliefs or expectations relating to, among other things, Ontex’s future results of operations, financial condition, liquidity, prospects, growth, strategies or developments in the industry in which we operate. By their nature, forward-looking statements are subject to risks, uncertainties and assumptions that could cause actual results or future events to differ materially from those expressed or implied thereby. These risks, uncertainties and assumptions could adversely affect the outcome and financial effects of the plans and events described herein.
Forward-looking statements contained in this report regarding trends or current activities should not be taken as a report that such trends or activities will continue in the future. We undertake no obligation to update or revise any forward-looking statements, whether as a result of new information, future events or otherwise. You should not place undue reliance on any such forward-looking statements, which speak only as of the date of this report.
The information contained in this report is subject to change without notice. No re-report or warranty, express or implied, is made as to the fairness, accuracy, reasonableness or completeness of the information contained herein and no reliance should be placed on it.
In most of the tables of this report, amounts are shown in € million for reasons of transparency. This may give rise to rounding differences in the tables presented in the trading update.
This trading update has been prepared in Dutch and translated into English. In the case of discrepancies between the two versions, the Dutch version will prevail.