- 4 out of 5 Divisions outperformed their markets with strong revenue growth in developing markets; annual revenue run-rate above €2 billion
- Another year of Adjusted EBITDA margin expansion in challenging environment
- Two acquisitions in the Americas, establishing a second strong regional platform to complement our European platform
Aalst-Erembodegem, March 8, 2017 – Ontex Group NV (Euronext Brussels: ONTEX; ‘Ontex,’ ‘the Group’ or ‘the Company’) today announced its results for the three and twelve months periods ending December 31, 2016.
FY 2016 Highlights
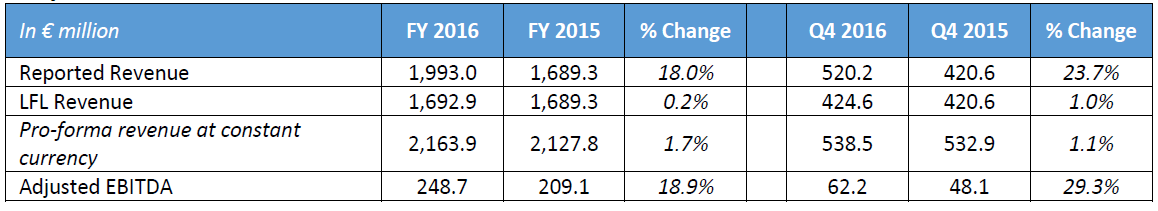
- Revenue of €1.99 billion was up 18.0% on a reported basis
- +1.7% pro-forma at constant currency
- +0.2% on a like-for-like (LFL) basis, year-on-year (yoy)
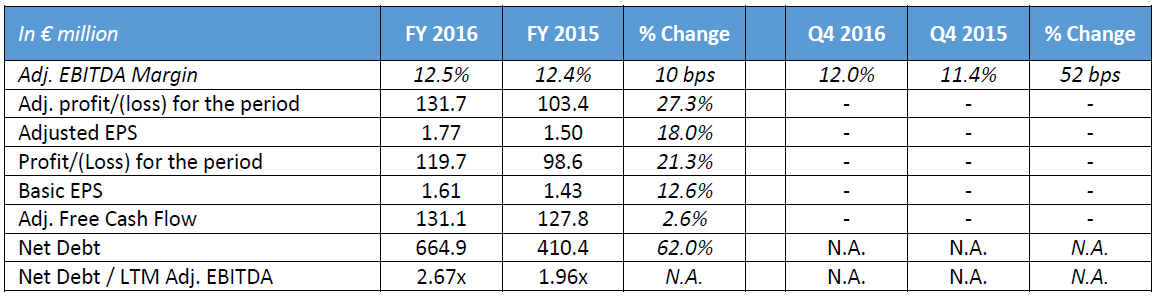
- Adjusted EBITDA of €248.7 million was 18.9% higher yoy, resulting in an Adjusted EBITDA margin of 12.5%, up 10bps versus a year ago
- Net foreign exchange (FX) headwinds of €46.9 million on revenue and €36.7 million on Adjusted EBITDA
- Adjusted net profit was €131.7 million and Adjusted earnings per share was €1.77, up 27.3% and 17.6% compared to a year ago, respectively.
- Net Debt was €664.9 million including €75.8 million of acquisition related earn-outs as of December 31, 2016, resulting in a net debt/LTM Adjusted EBITDA ratio of 2.67x
- Acquired Grupo P.I. Mabe S.A. de C.V. (“Grupo Mabe”) in March 2016, a leading Mexican based hygienic disposables business, marking our first steps into the Americas and announced agreement to acquire the personal hygiene business of Hypermarcas SA in Brazil
- The Board of Directors proposes to pay a gross dividend of 0.55 euro per share, subject to approval by shareholders at the next general meeting
Q4 2016 Highlights
- Revenue was €520.2 million, a yoy increase of 23.7% on a reported basis
- +1.1% pro-forma at constant currency
- +1.0% on a LFL basis versus FY 2015
- Adjusted EBITDA was up 29.3% to €62.2 million, giving an Adjusted EBITDA margin of 12.0%
- Net negative FX impact of €7.7 million on revenue and €1.7 million on Adjusted EBITDA
Key Financials FY 2016 and Q4 2016
Charles Bouaziz, Ontex CEO: “2016 was a year of significant achievements in a challenging environment. From a top line perspective, we outperformed our markets in 4 out of 5 Divisions, including double-digit LFL growth in developing markets. At the end of February we completed the deal with Grupo Mabe, marking our first steps into the Americas, and rapidly integrated the business into the Ontex family. Just before year end, we reached agreement to acquire the personal hygiene business of Hypermarcas, extending our growth platform in the Americas with leading market positions in Brazil.
At the same time, we have remained focused on restoring MMR to growth ahead of its markets while protecting profitability. We achieved further Adjusted EBITDA margin expansion through our efficiency and savings programs, and captured acquisition-related synergies slightly ahead of our expectations, while continuing to invest in the organization. Over the period since our IPO in 2014, I’m pleased that we are delivering on our profitable organic and inorganic growth model.”
Market Dynamics
Our categories continued to grow in 2016, though at a slower pace than initially anticipated. The average growth in the markets where we operate was flat to modest. Retailer brands maintained their strong position in Western Europe and gained share in Eastern Europe.
Compared to 2015, foreign exchange rates for most currencies relevant for Ontex led to significant net negative impacts on revenue and Adjusted EBITDA in 2016.
Market pricing for our main commodity raw materials overall were lower in 2016 year-on-year. Fluff pulp price indices, denominated in USD, declined slightly during 2016 yet are still at historically high levels. Indices for oil-based raw material prices in 2016 were below the prior year period. Based on current indices, we expect a negative impact from raw material costs in Q1 2017. We anticipate that oil-based raw material price indices will be higher in 2017 than the previous year.
OUTLOOK
We anticipate togrow revenue ahead of our markets in all Divisions in 2017, supported by commercial investments behind our brand portfolio and our retail partners’ brands. Following the acquisition of Hypermarcas personal hygiene, Ontex has a significantly different business mix, with more than half of our revenue from our own brands, and also half outside of Western Europe.
We expect the external environment to remain challenging in 2017, including volatile FX and some pressures on raw material costs. We will continue to drive efficiencies and savings from our enlarged platform, including acquisition-related synergies. We remain committed to modest margin expansion over time.
Progress on Acquisitions
We made significant progress in transforming the Group in 2016. On February 29th our deal with Grupo Mabe was completed, adding the strong number 2 position in Babycare in Mexico, the 5th largest hygiene market in the world. We set up the new Americas Retail Division for Grupo Mabe’s activities in the region, and focused on maintaining the positive commercial momentum and capturing operational synergies. The 2016 performance was very solid, with market share in Babycare surpassing 40% in modern retail for the first time ever, and Adult Incontinence moving up to the number 2 position, both in Mexico.
On December 23rd 2016 we announced an agreement to acquire the personal hygiene business of Hypermarcas, which is the market leader in Adult Incontinence and solid number 3 in Babycare in Brazil, the 4th largest hygiene market in the world. On March 6th 2017 we successfully completed this deal and started the integration process.
Going forward, more than 50% of Group revenue will be from Ontex brands, and more than half of Group revenue will be generated outside of Western Europe: two key milestones that demonstrate we are on track in transforming Ontex into a leading international consumer goods company.
Overview of Ontex Performance in 2016
FY 2016 Group revenue was €1.99 billion, driven by an annualized run-rate above €2 billion over the past three quarters. On a reported basis, revenue grew by 18.0% compared to last year including the contribution of Grupo Mabe since March 1st, and was up +0.2% on a LFL basis. Pro-forma FY 2016 revenue at constant currency including Grupo Mabe would have grown by 1.7%.
Adjusted EBITDA grew 18.9% year-on-year to €248.7 million in 2016. The DNA of Ontex is to capture efficiencies and savings year after year, which was fully confirmed again in 2016. FY 2016 Adjusted EBITDA margin of 12.5% was 10bps above prior year, and has averaged growth of 30bps annually over the past three years.
Operational Review: Divisions
Mature Market Retail
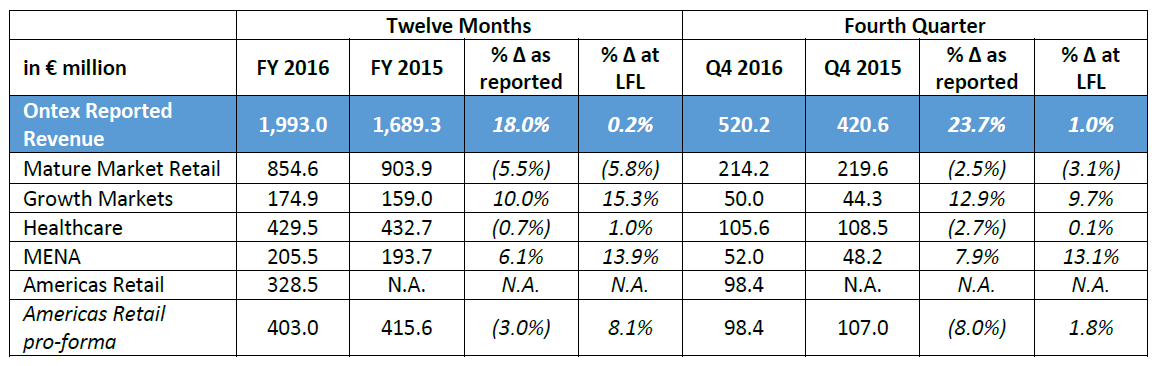
On a LFL basis, Mature Market Retail Divisional revenue in FY 2016 decreased 5.8%, and was 3.1% lower in Q4 2016. FY 2016 revenue grew in Poland and Germany, and declined in France and the UK. Our volumes improved in the second half of the year despite cycling some contract losses which were incurred in 2015. The pricing environment continued to be challenging with intensified promotional activities in the babycare category, led by the international branded suppliers. Our ambition remains to outperform the markets where we are present with a disciplined approach to pricing, and we anticipate that our efforts to grow existing customers’ businesses and gaining new business will positively impact our top line performance over the coming year.
Growth Markets
FY 2016 revenue in the Growth Markets Division grew 15.3%, strongly ahead of market growth, and was 9.7% higher in Q4 2016, both on a LFL basis. This strong revenue performance for the full year, on top of high growth in 2015, was mainly due to volumes increasing in Russia and Central Eastern Europe. We continued to leverage the Group’s strengths to develop our customers’ retailer brands where relevant, and elsewhere we are developing our own brand offering.
Healthcare
FY 2016 revenue in the Healthcare Division was up 1.0% on a LFL basis, ahead of estimated market growth, and up 0.1% in Q4 2016 on a LFL basis. Revenue increased on a LFL basis in Spain and the UK, while sales in France were lower. We made further progress in moving to one production site in Northern France, marked by the official inauguration of the new site in December which is already in production. In February 2017, it was announced that our iD for Men disposable pads had been voted ‘Product of the Year 2017 Belgium’1.
MENA
Middle East and North Africa Divisional revenue was 13.9% higher on a LFL basis in FY 2016 , and grew 13.1% on a LFL basis in Q4 2016. The strong FY 2016 revenue growth was largely due to higher volumes, and was broad-based with most markets and categories above last year. This very good performance was in spite of macroeconomic challenges and competitive pricing pressures. We continued to invest behind our brands Canbebe (babycare) and Canped (adult incontinence), including an innovative relaunch of Canbebe in Turkey, based upon insights from extensive consumer research.
Americas Retail
Revenue in our Americas Retail Division revenue increased by 8.1% in FY 2016 on a pro-forma basis at constant currency, and was up 1.8% on the same basis in Q4 2016 cycling a high comparable in 2015. A strong full year performance was achieved in Mexico, supported by successful relaunches of some of our baby diaper brands, and our Adult Inco business also had a solid year. As a result, we gained market share in the Babycare and Adult Inco categories. Sales in the US decreased in the second half of 2016 versus a high comparable in H2 2015.
Operational Review: Categories
Babycare
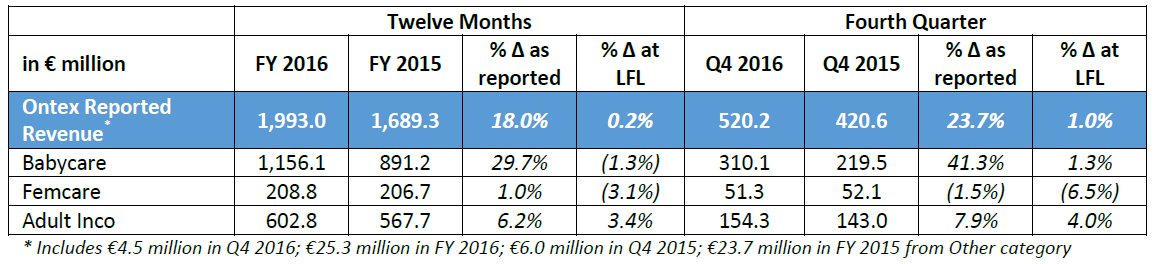
FY 2016 category revenue for Babycare was 29.7% higher compared to 2015 on a reported basis including the incremental contribution from Grupo Mabe, and 1.3% lower on a LFL basis. Category revenue was well ahead in developing markets. In developed markets, category revenue decreased due to lower baby diaper revenue due to contract losses from 2015, while sales of baby pants grew.
Femcare
Femcare category revenue in FY 2016 was up 1.0% on a reported basis, including Grupo Mabe sales, and 3.1% lower on a LFL basis. Nearly all of Ontex sales in the category are in Western Europe, where we slightly underperformed a market which decreased year-on-year.
Adult Inco
Revenue in the Adult Inco category grew 6.2% on a reported basis including Grupo Mabe, and 3.4% on a LFL basis. On a LFL basis, sales in retail channels grew 11% year-on-year, and sales in institutional channels were slightly higher.
Operational Review: Geographies
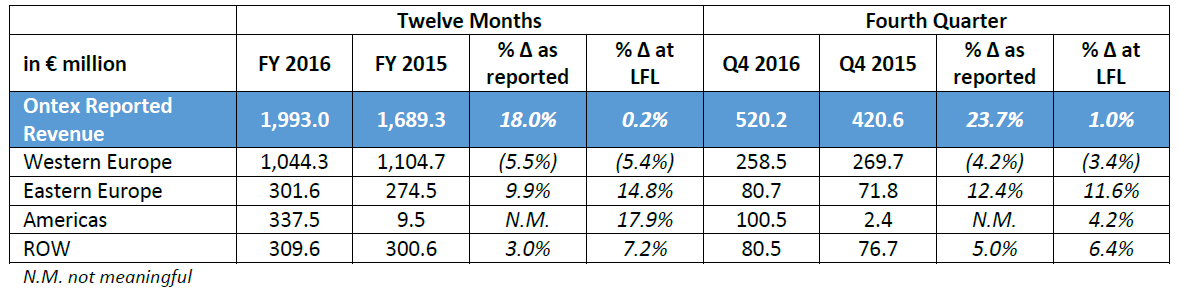 FY 2016 revenue in Western Europe decreased mainly as a result of lower sales on a LFL basis in retail channels. The proportion of FY 2016 Group revenue generated outside of Western Europe rose to 48% compared to 35% in FY 2015, due to LFL growth in developing markets and sales from the acquisition of Grupo Mabe.
FINANCIAL REVIEW
Selected P&L Financial Information
Selected Liquidity Financial Information
Gross Margin
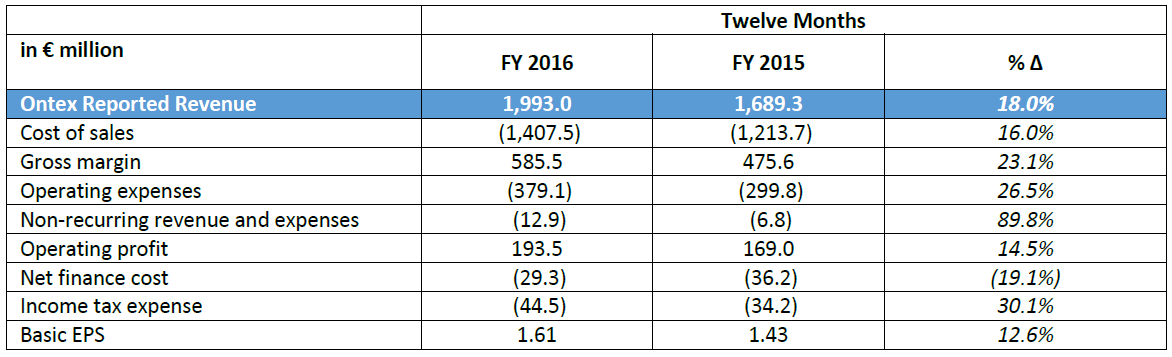
2016 gross margin of €585.5 million was 23.1% higher than last year. Gross margin as a percentage of sales increased 123 basis points, from 28.2% in 2015 to 29.4% in 2016. We continued to make significant efficiency gains and savings in 2016, and had an additional contribution including synergies from the acquisition of Grupo Mabe. Market prices of some commodity raw materials decreased during the year, however the positive impact of lower raw material indices was more than offset by currency headwinds.
Adjusted EBITDA
Adjusted EBITDA increased by 18.9% to €248.7 million in 2016. Our focus continued on gross margin improvements as detailed above, which allowed us to strengthen the company by investing in sales, marketing and other key functions. Adjusted EBITDA margin for FY 2016 was 12.5%, up 10bps year-on-year.
Foreign Exchange
Changes in foreign currencies versus the euro resulted in a negative impact on Group revenue and Adjusted EBITDA throughout 2016. The full year impact of -€46.9 million on revenue was mainly related to the British Pound, the Turkish Lira, the Russia Rouble and the Polish Zloty.
The FX impact on Adjusted EBITDA in 2016 was -€36.7 million, principally due to the US Dollar, the British Pound, the Turkish Lira, the Russia Rouble and the Polish Zloty.
In addition to the above, compared to 2015 the Mexican Peso weakened significantly, also versus our initial expectations at the time of acquisition.
Net Finance Costs
The 2016 net finance costs were €29.3 million, 19.1% lower than 2015. Total interest expenses were slightly higher in 2016 compared to the previous year with the difference in net finance costs due to net impact of exchange rate differences.
Income Tax Expense
The income tax expense was €44.5 million in 2016, resulting in an effective tax rate of 27.1%.
Working Capital
Working capital as a percentage of revenue was 11.6% in 2016, remaining in line with our objective of keeping working capital requirements at or below 12% of revenue.
Capex
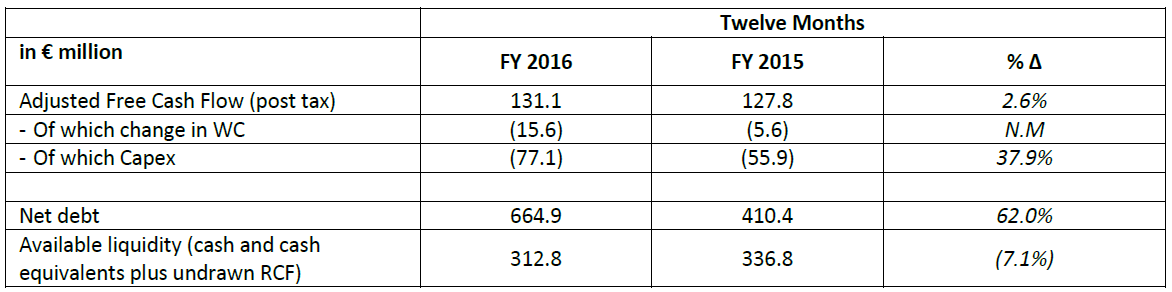
2016 capital expenditures amounted to €77.1 million, amounting to 3.9% of revenue. This is slightly higher than our historical average, which was highlighted in our H1 2016 results, due to the inclusion of Grupo Mabe and an important investment in IT systems.
Adjusted Free Cash Flow (post tax)
Adjusted free cash flow (post tax) was €131.1 million in 2016, which represented an increase of 2.6% compared to 2015. The increase is due to higher Adjusted EBITDA, partly offset by higher capex, working capital and cash taxes paid.
Financing and Liquidity
Net debt at December 31, 2016 amounted to €664.9 million, and net leverage based on the last twelve months Adjusted EBITDA was 2.67x. On December 23, 2016 we announced agreement to acquire Hypermarcas personal hygiene, which was completed on March 6 2017, paid from available cash, and from available and new debt facilities. We estimate net debt/LTM adjusted EBITDA to be in a range of 3.2x and 3.4x on completion, within our stated leverage range for a strategic acquisition. We also expect continued cash generation to result in net debt/LTM Adjusted EBITDA of around 3.0x by the end of 2017. We will continue to actively manage the balance sheet to maintain an efficient, flexible and resilient capital structure.
Cash and cash equivalents were €212.8 million at December 31, 2016.
The revolving credit facility of €100 million was undrawn at the end of December 2016, and available liquidity was €312.8 million.
Dividends
The Board of Directors has proposed a dividend of €0.55 per share, subject to shareholder approval at the next Annual General Meeting of Shareholders.
Corporate information
The above press release and related financial information of Ontex Group NV for the twelve months ended December 31, 2016 was authorized for issue in accordance with a resolution of the Board on March 7, 2017.
CONFERENCE CALL
Management will host a presentation for investors and analysts on March 8, 2017 at 8:00am GMT/9:00am CET.
A copy of the presentation slides will be available at: http://www.ontexglobal.com/financial-reports-including-annual-reviews
If you would like to participate in the conference call, please dial-in 5 to 10 minutes prior using the details below:
United Kingdom +44 (0)330 336 9105
United States +1 719 457 2086
Belgium +32 (0)2 404 0659
France +33 (0)1 76 77 22 74
Germany +49 (0)69 2222 13420
Passcode: 2004695
FINANCIAL CALENDAR 2017
Q1 2017 May 10, 2017
AGM May 24, 2017
H1 2017 July 27, 2017
Q3 2017 November 8, 2017
Contact
Notes to the Consolidated Financial Information
Note 1 Legal Status
Ontex Group NV is a limited-liability company incorporated as a “naamloze vennootschap“ (“NV”) under Belgian law with company registration number 0550.880.915. Ontex Group NV has its registered office at Korte Keppestraat 21, 9320 Erembodegem (Aalst), Belgium. The shares of Ontex Group NV are listed on the regulated market of Euronext Brussels.
Note 2 Accounting Policies
The accounting policies used to prepare the financial statements for the period from January 1, 2016 to December 31, 2016 are consistent with those applied in the audited consolidated financial statement for the year ended December 31, 2015 of Ontex Group NV. The accounting policies have been consistently applied to all the periods presented.
Note 3 Events after the Reporting Period
On January 25, 2017 a senior facilities agreement, comprised of a euro denominated Senior Term Loan Facility (Loan Facility D), due December 3, 2019 in an amount of €125.0 million has been entered into. The Loan Facility D in an amount of €125.0 million has an interest rate based on the EURIBOR plus a starting margin of 50 basis points. Borrowings under the Loan Facility D are used for the acquisition of Hypermarcas and paying costs and expenses relating to the Acquisition.
Borrowings under the senior term loan facility are accounted for at amortized cost.
On March 6, 2017 Ontex Group NV has completed the acquisition of 100% of the shares of the personal hygiene business of Hypermarcas S.A. (hereafter “HM personal hygiene”). The addition of HM personal hygiene supports the Ontex strategy by extending the growth platform in the Americas to Brazil, increasing revenue from Ontex-owned brands and accessing a fast growing market. HM personal hygiene has a portfolio of strong local brands covering all segments of the adult incontinence and babycare categories: BigFral and AdultMax in Adult Incontinence, PomPom, Cremer and Sapeka in Babycare.
The enterprise value agreed for the HM personal hygiene business was R$1 billion (€305 million), which has been paid from available cash, and from available and new debt facilities, after customary adjustments for net debt. HM personal hygiene will be consolidated into the results of Ontex with effect from March 1, 2017.
Pro forma unaudited net sales for the financial year 2016 amounted to R$ 1.2 billion for the acquired companies in compliance with Brazilian GAAP.
Acquisition related costs included in the non-recurring expenses in the Group consolidated income statement for the year ended December 31, 2016 amounted to € 2.0 million.
Note 4 Auditors Report
The statutory auditor has confirmed that the audit, which is substantially complete, has not to date revealed any material misstatement in the draft consolidated accounts, and that the accounting data reported in the press release is consistent, in all material respects, with the draft accounts from which it has been derived.
Note 5 Alternative Performance Measures
The following alternative performance measures (non-GAAP) have been included in this press release since management believes that they are widely used by certain investors, securities analysts and other interested parties as supplemental measure of performance and liquidity. The alternative performance measures may not be comparable to similarly titled measures of other companies and have limitations as analytical tools and should not be considered in isolation or as a substitute for analysis of our operating results, our performance or our liquidity under IFRS.
Like-for-like revenue (LFL)
Like-for-like revenue is defined as revenue at constant currency excluding change in perimeter of consolidation or M&A.
Pro-forma revenue
Pro-forma revenue is revenue of related to acquisitions for the comparable period in the prior year. Pro-forma revenue at constant currency is pro-forma revenue excluding FX.
Non-recurring Income and expenses
Non-recurring income and expenses are defined as those items that are considered to be non-recurring or unusual because of their nature. The non-recurring income and expenses relate to:
• acquisition costs;
• business restructuring costs, including costs relate to the liquidation of subsidiaries and the closure, opening or relocations of factories;
• asset impairment costs;
• IPO and refinancing costs.
EBITDA and Adjusted EBITDA and related margins
EBITDA is defined as earnings before net finance cost, income taxes, depreciations and amortisations. Adjusted EBITDA is defined as EBITDA plus non-recurring income and expenses and excluding non-recurring depreciation and amortisation. EBITDA and Adjusted EBITDA margins are EBITDA and Adjusted EBITDA divided by revenue.
Net financial debt/LTM Adjusted EBITDA ratio (Leverage)
Net financial debt is calculated by adding short-term and long-term debt and deducting cash and cash equivalents. LTM adjusted EBITDA is defined as EBITDA plus non-recurring income and expenses and excluding non-recurring depreciation and amortisation for the last twelve months (LTM).
Adjusted Free Cash Flow
Adjusted Free Cash Flow is defined as Adjusted EBITDA less capital expenditures (Capex, defined as purchases of property, plant and equipment and intangibles), less change in working capital, less cash taxes paid.
Adjusted Profit & Adjusted EPS (earnings per share)
Adjusted Profit is defined as profit for the period plus non-recurring income and expenses and tax effect on non-recurring income and expenses, attributable to the owners of the parent. Adjusted EPS is Adjusted Profit divided by the weighted average number of ordinary shares.
Working Capital
The components of our working capital are inventories plus trade and other receivables and prepaid expenses plus trade and other payables and accrued expenses.
Appendices in the press release attached above.